


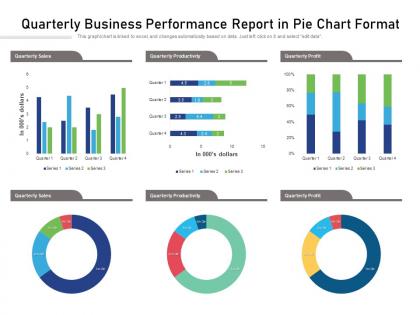
Quarterly business performance report in pie chart format




Try Before you Buy Download Free Sample Product
 Impress Your
 Audience
 100%
100% Editable
 Save Hours
 of Time


Our Quarterly Business Performance Report In Pie Chart Format are topically designed to provide an attractive backdrop to any subject. Use them to look like a presentation pro.
People who downloaded this PowerPoint presentation also viewed the following :
Quarterly business performance report in pie chart format with all 2 slides:
Use our Quarterly Business Performance Report In Pie Chart Format to effectively help you save your valuable time. They are readymade to fit into any presentation structure.
FAQs for Quarterly business performance report in
Honestly, start with the big three: revenue growth, profit margins, and cash flow. Those tell you if you're actually making money and won't go broke next month. Customer acquisition cost vs lifetime value is critical too - especially when you're growing fast. Track operational stuff that matters for your business type. Inventory turnover if you sell products, employee productivity if you're service-based, whatever. I always tell people to find 5-7 KPIs that directly connect to your quarterly goals. More than that and you'll just get overwhelmed by spreadsheets. Pick what actually moves your business forward, not vanity metrics.
Pull 8-12 quarters of data first - revenue, margins, customer costs, retention rates. Excel's honestly fine for this, no need to get fancy. Plot everything on line graphs so you can actually see the trends vs random seasonal stuff. When you spot changes, that's where it gets interesting. Dig into what was happening then - new competitors, market shifts, internal changes you made. The real insight comes from matching your strategic moves to performance spikes or drops. Oh, and make templates for quarterly reviews. Sounds boring but you'll thank me later when you're not reinventing the wheel every time.
Benchmarks are like your reality check - they tell you if your quarterly numbers actually mean something. Growth of 15% sounds great until you realize your competitors hit 22%, you know? Without comparing yourself to industry averages, you're basically flying blind. Plus stakeholders love seeing real data points when you're explaining results. I'd grab 3-5 metrics that actually matter to your business first, then hunt down reliable industry data to stack up against. Otherwise you might think you're crushing it when really you're just... not failing spectacularly.
Honestly, quarterly reports are goldmines for figuring out when to pivot. The data shows what's actually working vs. what you hoped would work - and trust me, numbers don't sugarcoat things like we do. I'd dig into revenue streams and expenses first to catch trends early. Compare against industry benchmarks too. Double down on whatever's driving growth, then tackle the underperforming stuff that needs quick fixes. Most people just file these reports away, but you should use them to set concrete changes for next quarter. It's basically your reality check every three months.
Honestly, build in multiple checks before things go sideways. Set up automated rules to catch weird outliers first - saves so much headache later. Then get someone else to double-check your math and source docs. I always compare numbers to last quarter and industry stuff too (can't tell you how many times this caught my dumb mistakes). Don't wait until quarter-end for reconciliations - do them throughout. Oh, and write down your process so people can actually follow your work later. Trust me on the documentation thing.
Honestly, visual storytelling is everything with quarterly results. Charts and graphs beat dense data tables every time - stakeholders' eyes just glaze over otherwise. Start with a quick executive summary covering your big wins and what went wrong. I've sat through way too many 20-slide disasters where you can't find the actual point until slide 15! Make sure your story stays consistent whether you're talking to investors, the board, or your team. Oh and here's the thing - don't just rehash old numbers. Give them forward-looking insights and what you're actually doing next. That's what they really care about.
Don't wait until the last minute - that's when you miss the important stuff and make terrible calls. Also, resist cherry-picking only the good numbers. Your stakeholders aren't stupid, they'll spot the gaps immediately. One thing that drives me crazy is when people compare Q1 to Q4 without thinking about seasonality. Makes zero sense. Get input from other teams early instead of going solo on this. Oh, and context matters more than the raw data sometimes. Start gathering everything at least two weeks out so you're not scrambling.
Look at what's actually driving your numbers this quarter, not just the final totals. Seasonal stuff? New products? Market weirdness? Don't just draw a straight line forward - that's how forecasts die. Factor in anything big coming up like new team members or launches. I learned this the hard way, but always pad it 10-15% because random stuff will happen. Three scenarios work best: conservative, realistic, optimistic. Plan for realistic but honestly? Keep that conservative one handy because Murphy's law is real in business.
Yeah, seasonal swings will mess with your quarterly numbers big time if you don't watch out. Holiday businesses obviously crush Q4, then everyone's broke in Q1. Compare year-over-year instead - like Q3 2024 vs Q3 2023. Don't go Q3 to Q2 or you'll freak out over normal dips. I made that mistake once and thought we were tanking! Figure out your industry's usual patterns first. Some sectors are just weird that way. Then you won't panic when things look off but are actually totally normal for that time of year.
Honestly, tech makes quarterly analysis so much faster and way more precise. Instead of manually grabbing reports from like 5 different systems, just automate that data collection - you'll save literal hours. Real-time dashboards are clutch because you can catch trends while they're happening, not weeks later. AI stuff helps spot patterns too, though sometimes it gets weird with outliers. Your team can actually collaborate properly with the right platforms instead of endless email chains. I'd probably start with automating whatever takes you the longest right now, then add more features gradually.
Pick 2-3 customer metrics that actually matter to your goals - NPS, satisfaction scores, retention rates, whatever fits. Then just review them every quarter with your financial stuff. Honestly, customer data usually predicts future performance way better than current revenue numbers do anyway. Set up some kind of dashboard that pulls feedback themes and connects them to business results. The trick is making it routine, not something you do once and forget about. I'd probably start with support ticket trends since those are easy to track. Make it regular and you'll start seeing patterns you totally missed before.
Honestly? Revenue growth, profit margins, and cash flow are your big three. Cash flow's the one that'll keep you up at night - doesn't matter how much you're "making" if customers aren't actually paying. Track customer acquisition cost vs lifetime value too. Then add maybe 2-3 metrics that actually matter for your specific business. I see too many founders drowning in spreadsheets full of useless numbers. Stick to 5-7 core things max and watch them consistently so you can catch problems before they blow up.
Honestly, quarterly reviews are where you can actually beat the big guys - you can pivot way faster when you spot something early. Here's the thing though: what drives your revenue is probably totally different from what you originally planned (happens every time). Pick maybe 3-4 metrics that actually matter to your specific business, not some laundry list of everything. When you compare quarters, you'll start seeing patterns emerge. Double down hard on what's working and just cut the rest. The game-changer is using those insights to set realistic goals for next quarter instead of just making stuff up.
Set up monthly check-ins instead of waiting the full three months to see what's happening. Real-time dashboards are clutch for catching problems early. Here's what really makes the difference though - do actual retrospectives with your team after each quarter. Like a post-mortem but for your business numbers. Write down what worked and what bombed, then pick 2-3 specific things to fix before the next quarter kicks off. Most companies just analyze everything forever and never actually do anything about it, which honestly drives me crazy.
Dude, you absolutely need everyone in the room for quarterly reviews. We learned this the hard way last year - sales looked amazing but customer success was quietly dealing with tons of people jumping ship. Marketing, finance, product, operations... get them all talking early in the process, not just at the end when it's too late. Sales can show killer numbers while product's firefighting major bugs nobody mentioned. It completely changes the story. Honestly, some of our "best" quarters were actually hiding serious problems. Start setting up those cross-department meetings way earlier next time.
-
Amazing product with appealing content and design.
-
Graphics are very appealing to eyes.
-
Unique and attractive product design.
-
Excellent products for quick understanding.