


S And Op Powerpoint Presentation Slides





Try Before you Buy Download Free Sample Product
 Impress Your
 Audience
 100%
100% Editable
 Save Hours
 of Time


Introducing our content ready S And Op Powerpoint Presentation Slides. Make a strategic plan by including mission goals, objectives, strategies and financial projection with the help of readily available operational plan PPT graphics. Showcase the business strategy that will help in accomplishing business goals and to secure a competitive position in the market. Estimate future financial outcomes for a company or project with the help of sales & operations management PowerPoint templates. Utilize our professionally designed business operations analysis PPT slideshow and provide a clear picture of how a team, section or department will contribute to the achievement of the organization’s goals. Also, mention operational objectives such as cost and volume, quality, efficiency, and flexibility. With the help of supply and demand PPT slide deck, You can also represent the performance objectives that will allow you to know how effectively a business generates revenue from total assets, working capital, fixed assets. This download this ready to use integrated business planning ppt Presentation to focus on future actions.
People who downloaded this PowerPoint presentation also viewed the following :
Content of this Powerpoint Presentation
Slide 1: This slide introduces S&OP. State your company name and begin.
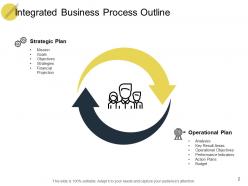
Slide 2: This slide presents the outline of Integrated Business Process.
Slide 3: This slide showcases Strategic Planning.
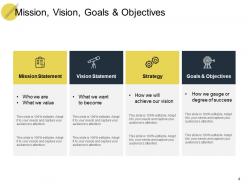
Slide 4: This slide showcases Mission, Vision, Goals & Objectives.
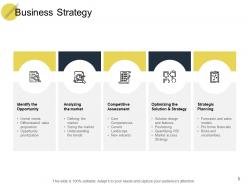
Slide 5: This slide depicts the Business Strategy. Showcase the strategies such as- Competitive Assessment, Core Competencies, Current Landscape, New entrants, Optimizing the Solution & Strategy, Solution design and features, Positioning, Quantifying ROI, Market access Strategy, Strategic Planning, Forecasts and sales models.
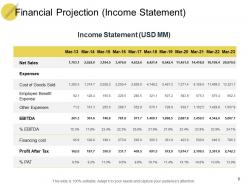
Slide 6: This slide showcases the Financial Projection showcasing income statement.
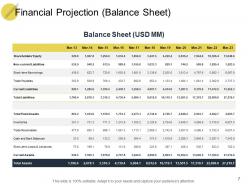
Slide 7: This slide depicts Financial Projection- Balance Sheet.
Slide 8: This slide displays the Operational Plan.
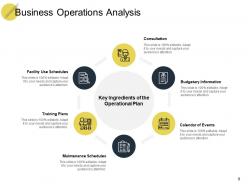
Slide 9: This slide showcases Key Ingredients of the Operational Plan such as- Business Operations Analysis Consultation, Budgetary Information, Calendar of Events, Facility Use Schedules, Training Plans, Maintenance Schedules.
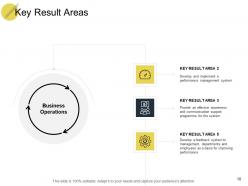
Slide 10: This slide showcases the Key Result Areas.
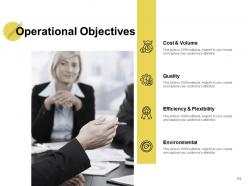
Slide 11: This slide showcases the Operational Objectives such as- Cost & Volume, Quality, Efficiency & Flexibility, Environmental.
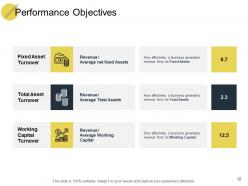
Slide 12: This slide showcases the Performance Objectives.
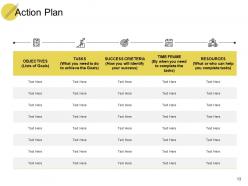
Slide 13: This slide displays the Action Plan.
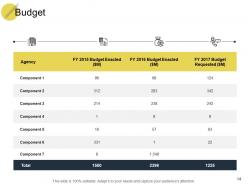
Slide 14: This slide displays the Budget.
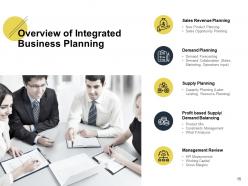
Slide 15: This slide provides an Overview of Integrated Business Planning.
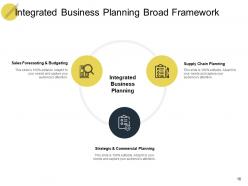
Slide 16: This slide depicts Integrated Business Planning Broad Framework.
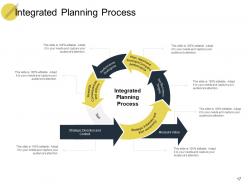
Slide 17: This slide showcases Integrated Planning Process. Showcase the processes such as- Integrated Planning Process Measure Value, Strategic Direction and Context, Strategic Initiatives and their ownership, Set Business Targets, Performance Dialogues, Plan, report and Forecast Company performance.
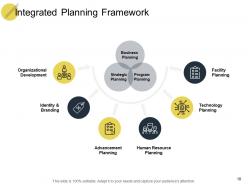
Slide 18: This slide depicts the Integrated Planning Framework such as- Organizational Development, Identity & Branding, Advancement, Planning, Human Resource Planning, Technology Planning, Facility.
Slide 19: This is S&OP Icons Slide.
Slide 20: This slide displays the time for Coffee break. Have a break for 15 minutes.
Slide 21: This slide is titled as Additional Slides for moving forward.
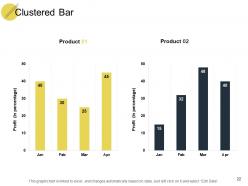
Slide 22: This slide presents Clustered Bar chart with data in percentage.
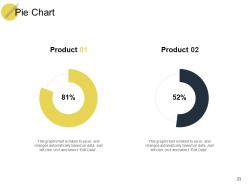
Slide 23: This slide displays Pie Chart with data of products in percentage.
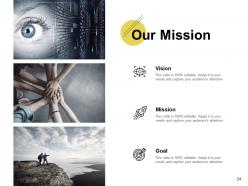
Slide 24: This is Our Mission slide. Showcase your vision, mission and values.
Slide 25: This is Our Team slide with names and designation.
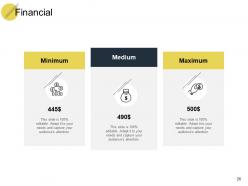
Slide 26: This is Financial slide.
Slide 27: This is About Us slide to showcase company specifications.
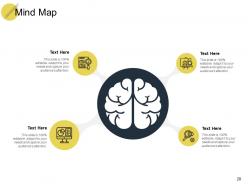
Slide 28: This slide displays the Mind Map.
Slide 29: This is Target slide to show targets of the company.
Slide 30: This is Puzzle slide with text boxes.
Slide 31: This is Quotes slide. You can mention the motivational quotes.
Slide 32: This is Lego slide with icons.
Slide 33: This is Contact Us slide with email address, contact number, address.
Slide 34: This is Thank You slide.
S And Op Powerpoint Presentation Slides with all 34 slides:
Address emotive issues with our S And Op Powerpoint Presentation Slides. Impress them with your level headed approach.
-
S OP
-
Integrated Business Process Outline
-
Strategic Planning
-
Mission Vision Goals Objectives
-
Business Strategy
-
Financial Projection Income Statement
-
Financial Projection Balance Sheet
-
Operational Plan
-
Business Operations Analysis
-
Key Result Areas
-
Operational Objectives
-
Performance Objectives
-
Action Plan
-
Budget
-
Overview of Integrated Business Planning
-
Integrated Business Planning Broad Framework
-
Integrated Planning Process
-
Integrated Planning Framework
-
S OP Icons Slide
-
Coffee Break
-

Additional Slides
-
Clustered Bar
-
Pie Chart
-
Our Mission
-

Our Team
-
Financial
-
About Us
-
Mind Map
-
Target
-
Puzzle
-

S and Op
-
Lego
-

Contact Us
-

Thank You
FAQs for S And Op
Strategy is your big picture stuff - like where you want to be in 5 years and how you'll beat competitors. Operations? That's the daily grind that actually gets things done. You can think of strategy as the "what and why" while ops handles "how and when." Here's the thing though - they're completely tied together. Amazing strategy is useless if you can't execute it well. And being super efficient at operations without clear direction just means you're spinning your wheels really fast. The trick is making sure your day-to-day work actually pushes you toward those bigger goals you set.
Honestly, the best alignment happens when your strategy team actually talks to ops regularly - like, sits in the same meetings kind of regularly. Your daily operations should directly support whatever strategic goals you've set. But here's the thing that most companies mess up: ops needs to feed insights back up the chain too. Those front-line folks usually know what's really working way better than executives do. Don't let strategy live in some ivory tower while operations just blindly follows orders. Both teams gotta inform each other, or you'll end up with beautiful plans that crash into reality.
Look, S&OP without solid data analytics is pretty much useless - you're just guessing at everything. The analytics let you actually see demand patterns, supply issues, inventory problems, and how it all hits your bottom line. I'd honestly start with cleaning up your demand forecasting data first since that usually gives you the biggest bang for your buck. You can spot trends before they smack you in the face, catch bottlenecks early, and test out different scenarios. My old boss used to say it's like the difference between driving with your eyes open versus closed. Short sentences work. But you need those longer insights flowing together to really understand what's happening across your entire supply chain.
Look, S&P basically helps you figure out where customers are getting pissed off and fix those spots first. Data analytics lets you predict what they need before they even ask - pretty cool actually. You can staff better during busy periods and automate the boring stuff so your team builds real relationships instead. Everything connects in real-time too, so you see the whole customer journey. Start with your worst pain points though. Like, seriously map out where people complain most and tackle those workflows. That's where you'll notice changes fast. It's honestly like night and day when it all clicks.
Track your forecast accuracy and inventory turns first - those are the obvious ones. But honestly? The meeting vibes tell you way more than spreadsheets sometimes. Are departments actually talking to each other now instead of pointing fingers? Decision speed matters too - if you're still taking forever to pivot when the market shifts, something's broken. Service levels and hitting financial targets are solid metrics. Oh, and measure your planning cycle times because nobody wants those marathon monthly meetings that drag on forever. Start with maybe 3 metrics that actually matter to your specific situation and don't overthink it.
Honestly, the biggest pain points are data silos and getting teams to actually communicate. Sales wants to promise the moon while ops is laser-focused on cutting costs - those priorities clash constantly. Getting clean data flowing between systems is a nightmare too. Oh, and people hate changing how they've done things for years, which... fair enough I guess? But seriously frustrating. I'd start small with just one product line, grab some quick wins to prove it works, then scale up. Way easier than trying to boil the ocean from day one.
So digital transformation basically gives you real-time data instead of waiting forever for spreadsheet updates. You can pull live demand signals from everywhere and pivot fast. The AI forecasting stuff is pretty solid - way better than old-school methods, though it's only gonna work if your data isn't garbage. What really changed things for us was getting teams to collaborate live instead of emailing reports around constantly. Machine learning helps spot demand patterns you'd totally miss otherwise. Honestly, I'd start by figuring out where your biggest data gaps are first.
Looking at companies who've actually figured this out - Amazon's the obvious one, right? They somehow know what you want before you do, which is honestly a little creepy but works. Zara's smart too - they use real-time sales data to tweak production in weeks instead of months. P&G broke down those annoying silos between their sales and ops teams. The common thread? They all invested in cross-functional teams and connected their tech systems. I'd start by figuring out where your sales and operations data are stuck in separate systems - that's probably your biggest win waiting to happen.
Look, S&P is just your monthly reality check between what sales wants to sell and what you can actually make. Basically coordinates demand forecasts with production capacity and inventory - think of it as translating between overly excited sales people and the ops team who's like "uh, no." You get everyone in a room monthly to compare forecasts against what actually happened. The whole point is spotting shortages or overstock situations months out so you can tweak manufacturing schedules, procurement, distribution - whatever needs fixing. Honestly it's one of those things that sounds boring but saves your butt when done right.
Look, benchmarking your S&Op is like getting a wake-up call about where you really stand. Most companies think they're doing fine until they see the actual numbers compared to everyone else. You'll catch stuff like crappy forecast accuracy or slow inventory turns that are bleeding money. What really gets me is how often you find out other companies solved your "impossible" problem with something dead simple. Focus on maybe 3 or 4 key metrics first - don't go crazy trying to compare everything. The real gold is figuring out what the top performers do differently.
Break down those silos by getting S and Ops teams working on shared goals. Weekly syncs help, but the real fix is aligning their metrics - right now S chases growth while Ops worries about execution, which is backwards. Joint planning sessions work well, plus cross-functional projects where they actually have to collaborate. I'd start small with one project to build momentum first. Job shadowing's surprisingly effective too - helps each side understand what the other deals with daily. The key thing? Make sure both teams get measured on the same outcomes so they're incentivized to win together.
Okay so for supply chain tech, start with visibility tools first - that's where you'll see the biggest impact right away. SAP IBP or Oracle DEMANTRA are solid for demand forecasting, and you'll need an ERP to tie everything together. Real-time dashboards help you catch problems before they become disasters. Inventory optimization software keeps your stock balanced too. Oh and don't underestimate collaboration tools like Slack - cross-functional teams need to actually talk to each other. Here's the thing though: resist the urge to implement everything at once. Pick one main platform and build from there. Trust me on this one.
Honestly, cultural fit is huge for how Sales and Ops get along. When you're on the same page values-wise, communication flows better and there's way less drama in daily stuff. Everyone just gets the unspoken rules, you know? But misalignment? Total nightmare. You'll have Sales thinking something's totally fine while Ops is losing their minds over it. Different risk levels, clashing communication styles - some people are super direct, others beat around the bush. I'd say figure out where the biggest gaps are first, then tackle those. Don't try to fix everything at once or you'll go crazy.
Start with the basics that actually matter to customers - fill rates, on-time delivery, and how fast you're turning inventory. Cash flow loves these metrics too. Track your cost per unit shipped and forecast accuracy, though good luck with that last one since marketing changes their plans every other week. Don't sleep on supplier stuff either - lead time consistency and quality scores will save your butt later. The trick is not going crazy optimizing service while your costs explode. Build a simple dashboard with these five and check it weekly.
Basically break your security and ops work into sprints like any other agile project. Security teams can do shorter vulnerability cycles and continuous testing. Ops focuses on frequent deployments and automated monitoring. The real game-changer? Getting both teams in the same agile framework together - no more blame games when stuff breaks, which honestly happens way too often. Joint retrospectives are huge for this. Both teams can align priorities and create those feedback loops you need for faster, more secure releases. It's weird how much smoother everything runs when everyone's actually talking to each other.
No Reviews