


Tam powerpoint presentation slides





Try Before you Buy Download Free Sample Product
 Impress Your
 Audience
 100%
100% Editable
 Save Hours
 of Time


Explore our TAM PowerPoint Presentation Slides to make a great business Presentation for your investors. Our topic specific total addressable market PowerPoint complete deck contains content ready slides such as company overview, product/ service categorization, industry analysis, steps in determining market size approaches to TM, market segmentation, market trend analysis, buyer’s persona, competition market share analysis, total addressable market overview, TAM forecasting, conclusions & recommendations etc. The presentation is fully editable. You can modify, color, text, and font size. Markets segmentation and analysis PPT visuals help to showcase the potential scale of the market. Build an understanding, where your market begins and ends using Total available market Presentation template. Furthermore, target market presentation slides are apt to present various topics like demographic profile, mass marketing, niche marketing, precision marketing, serviceable available market and many more. Outline all the important concepts without any hassle. Download this to focus on strategic marketing and sales efforts.
People who downloaded this PowerPoint presentation also viewed the following :
Content of this Powerpoint Presentation
Slide 1: This slide introduces TAM. State Your Company Name and begin.
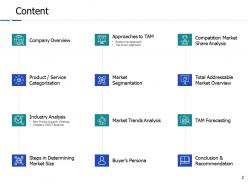
Slide 2: This slide shows Content of the presentation.
Slide 3: This is an Agenda slide. State your agendas here.
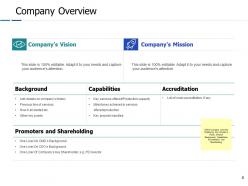
Slide 4: This slide presents Company Overview describing the company’s Vision, Mission ,Background, Capabilities, Accreditation, and Shareholding.
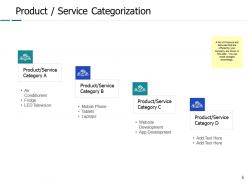
Slide 5: This slide displays Product / Service Categorization with 4 categories to present.
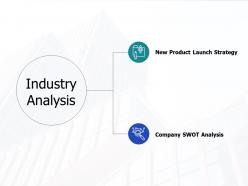
Slide 6: This slide represents Industry Analysis describing- New Product Launch Strategy, Company SWOT Analysis.
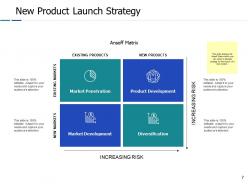
Slide 7: This slide showcases New Product Launch Strategy with the help of Ansoff matrix.
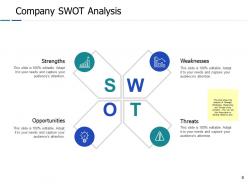
Slide 8: This slide shows Company SWOT Analysis. You can use this information to develop effective plan.
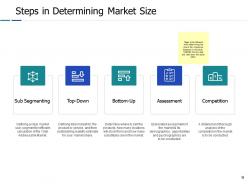
Slide 9: This slide presents Steps in Determining Market Size as- Sub Segmenting, Top-Down, Bottom-Up, Assessment, Competition.
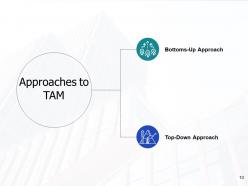
Slide 10: This slide displays Approaches to TAM as- Bottoms-Up Approach and Top-Down Approach.
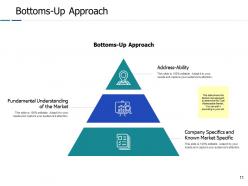
Slide 11: This slide shows the Bottom-top approach to determine the Total Addressable Market. You can edit it as per requirements.
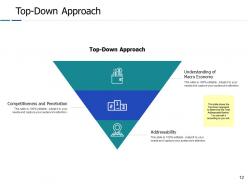
Slide 12: This slide shows the Top-Down approach to determine the Total Addressable Market. You can edit it according to your will.
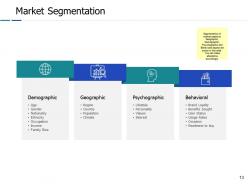
Slide 13: This slide presents Market Segmentation based on factors such as Demographic, geographic, psychographic and behavioral.
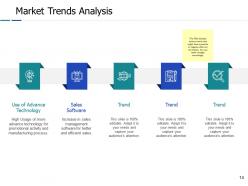
Slide 14: This slide displays Market Trends Analysis describing various trends that might have a positive or negative effect on the market.
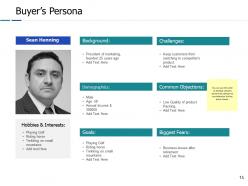
Slide 15: This slide represents Buyer’s Persona with- Hobbies & Interests, Background, Demographics, Goals, Challenges, Common Objections, Biggest Fears.
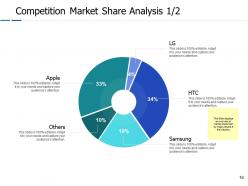
Slide 16: This slide showcases Competition Market Share Analysis with the help of donut pie chart.
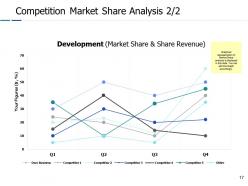
Slide 17: This is another slide showcasing Competition Market Share Analysis with the help of line graph.
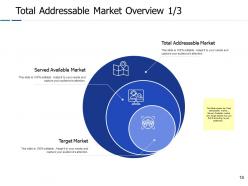
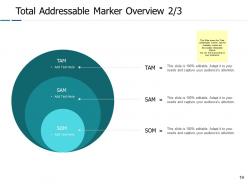
Slide 18: This slide shows Total Addressable Market Overview describing- Served Available Market, Target Market, Total Addressable Market.
Slide 19: This is another slide presenting Total Addressable Market Overview.
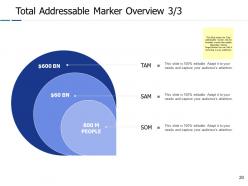
Slide 20: This is another slide with Total Addressable Marker Overview.
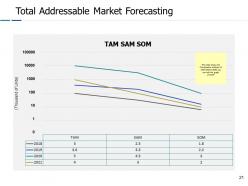
Slide 21: This slide displays Total Addressable Market Forecasting comparing TAM, SAM and SOM.
Slide 22: This slide is titled as Conclusion & Recommendations. Use this slide to conclude the meeting and display various recommendations.
Slide 23: This slide is titled as Additional Slides for moving forward.
Slide 24: This is Our Mission slide with related imagery and text.
Slide 25: This is Our Team slide with names and designation.
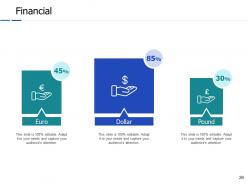
Slide 26: This is a Financial slide. Show your finance related stuff here.
Slide 27: This is a Quotes slide to convey message, beliefs etc.
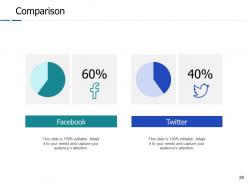
Slide 28: This is a Comparison slide to state comparison between commodities, entities etc.
Slide 29: This is About Us slide to show company specifications etc.
Slide 30: This slide is titled as Post it. Post your important notes here.
Slide 31: This is Our Target slide. State your targets here.
Slide 32: This is a Puzzle slide with text boxes.
Slide 33: This is a Thank You slide with address, contact numbers and email address.
Tam powerpoint presentation slides with all 33 slides:
Handle acts of immaturity with our TAM Powerpoint Presentation Slides. Get a grip over intense emotions.








FAQs for Tam
Alright, so TAM analysis needs three layers to actually work. Bottom-up is where I'd start - base it on real customer segments and what you'll actually charge. Most people totally blow this part because they get way too optimistic about conversion rates, which is honestly just setting yourself up for disappointment later. Then do top-down with industry reports and outside-in competitor analysis to double-check everything. The key thing? Be brutally honest about what slice of that huge market you can realistically grab given your value prop and how you're planning to sell. Don't fall into the "if we just get 1% of this billion-dollar market" trap.
Honestly, you can't rely on just one method - competitive markets are too messy for that. I'd start by counting up your potential customers and multiplying by what they'd spend. Then grab some top-down market research to compare. The real number usually falls somewhere in between, though market research tends to be way too optimistic IMO. Check out what your competitors are charging and how many customers they have. That'll help validate your math. Oh, and be super conservative with penetration rates - competition means you won't capture nearly as much as you think. Build a range, not one exact number.
TAM is huge for your pitch deck - shows investors the opportunity is actually worth their time. Break it down into real numbers that make sense, not some crazy inflated thing you found on Google. Most VCs have seen terrible TAM slides a million times, so yours needs to be solid or they'll tune out fast. Your growth projections better match up with the market size too. Smart investors will catch that mismatch right away. Bottom line - you're trying to prove there's enough room to build something massive, like actually massive. The math has to work or you're dead in the water.
So TAM is basically the entire pie - like if you somehow got every single person who could ever use your product. Pretty unrealistic but good for the big picture. SAM cuts that down to who you can actually reach with your current setup and resources. SOM is where it gets real though - that's what you can actually grab considering competitors are gonna fight you for every customer. I always tell people to dream with TAM but plan with SOM, you know? Like sure, maybe everyone needs your app, but how many will you actually convert? That's the number that matters for your business plan.
Honestly, bottom-up is your only real option here since there's basically no historical data to work with. I'd start by figuring out your customer segments and estimating potential users in each one, then multiply by whatever you think you can charge. Proxy markets work too - ridesharing companies originally used taxi data as their baseline (even though they ended up way bigger). Surveying potential customers about what they'd pay is pretty valuable, plus you can ask what they're currently spending on alternatives. Oh and definitely use multiple methods because your estimates are gonna be rough no matter what.
Dude, measuring TAM is so much easier now with all the tech we have. Instead of relying on those dusty industry reports, you can pull real-time data straight from APIs and web scraping tools. Social listening shows actual demand patterns, and AI helps spot trends you'd totally miss doing it manually. The old Excel spreadsheet approach? Pretty much dead at this point. What works best is mixing different data sources - maybe grab 2-3 tools that track live market data for whatever space you're in. Way more accurate than the guesswork we used to do.
Look, TAM basically tells you where to spend your time and money. Big enterprise market? That's where your sales team should be camping out. Small niche? Maybe rethink your $100M revenue dreams if the whole pie is only $50M. I use it to figure out which regions or industries to tackle next - saves you from chasing dead ends. Your sales folks will thank you too since they'll have real numbers when prospects start asking about market size. Honestly, most people skip this step and wonder why their strategy feels all over the place. Calculate TAM first, then hunt where the money actually is.
Dude, the classic screw-up is being way too rosy about your addressable market. Companies just multiply huge numbers and boom - that's their TAM. But like, not everyone who *could* buy will actually buy, you know? Also watch out for stale data or pretending geography doesn't matter. I've seen startups act like regulatory stuff won't block them in certain regions - spoiler alert, it will. Start bottom-up with real customer numbers first. Then check that against industry reports so you're not totally delusional about what's actually within reach right now.
Demographics are huge for getting your TAM right - honestly, they're like the backbone of the whole thing. You've gotta know who your customers actually are: ages, income, where they live, how they shop. Without that stuff, you're basically guessing wildly and probably way off. More detailed breakdowns help you segment better and avoid thinking demand is higher than it really is. I'd start with census data and industry reports first - customer surveys too if you can swing it. Build that realistic profile before you dive into the actual TAM math, otherwise you'll just end up with garbage numbers.
Look at Uber - they started with taxi/car service spending data globally, which totally helped with early funding rounds. Netflix did the same thing with video rental numbers before streaming took off. Airbnb used hotel industry data too, though honestly they blew past those original estimates by creating something way bigger. The trick is starting with real market data first. Then you can show how your specific approach might capture or expand that market differently. It's not rocket science, but having those solid baseline numbers makes everything else way more credible when you're pitching.
Look at your TAM and find the gaps bigger companies are sleeping on. Break it down by industry or company size - there's usually some sweet spot they're ignoring. Honestly, this stuff is catnip for investors too. They want to see you actually get your market and aren't just throwing darts at a board. Move fast on those niches before anyone notices what you're doing. Own the smaller pieces first, then expand from there. Way smarter than trying to take on everyone at once from day one.
Honestly, Excel's still your best bet to start. Most teams I know build their models there since you can tweak assumptions on the fly. If you need prettier visuals later, Tableau or Power BI work great - especially when you're pulling data from different places. For actual industry numbers, CB Insights and PitchBook are solid (though PitchBook can be pricey). Statista's decent too. Some folks swear by Gartner's frameworks if your company has access, but honestly that might be overkill depending on what you're doing. I'd just start simple with Excel first. You can always get fancy later.
Going international can seriously blow up your TAM - like 10x bigger depending on what you're selling. But here's the thing, don't just multiply your US numbers by population. That's rookie math. You've got to dig into currency differences, what people actually spend money on, and whether regulations will kill you. Some markets look amazing until you realize their payment systems suck or everyone's already loyal to competitors. Honestly? Pick 2-3 countries max and really understand those markets first. Way better than trying to figure out the entire world at once.
TAM gets sketchy when you're dealing with brand new markets or tech that's never existed before. Like, who could've predicted the app store economy in 2006? Nobody had a clue. It's also unreliable in super fragmented markets or emerging economies where regulations change constantly. If your product completely shifts how people behave, traditional market sizing is pretty much worthless. Oh, and niche segments are tricky too - the broader TAM won't show your real opportunity. Always test your assumptions with actual customer interviews first, not just spreadsheet math.
Honestly, refresh your TAM every 6-12 months - don't just build it once and call it done. Markets are constantly shifting anyway, plus let's be real, your first assumptions were probably off (mine always are). Watch for signals that your addressable market is growing or shrinking. Customer behavior shifts, new use cases pop up, adjacent markets suddenly become relevant. I'd set up quarterly check-ins where you actually revisit those core assumptions with real data you've gathered. The whole thing should feel like a living doc, not some static spreadsheet collecting dust.
No Reviews