


Salary Survey Report Powerpoint Presentation Slides


Try Before you Buy Download Free Sample Product
 Impress Your
 Audience
Editable
of Time


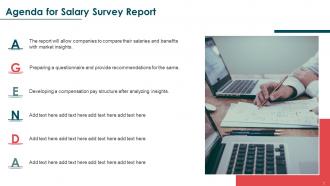
Salary survey report allows organizations to compare their salaries and benefits with market insights. After analyzing insights, the report develops a compensation pay structure and prepares a questionnaire to provide recommendations. Grab our competently designed Salary Survey Report template that illustrates details for salary and compensation pay trends, salary surveys, etc. The salary assessment report displays employee headcount snapshots, employee analytics showing low salary concerns, employee analytics dashboards, etc. Furthermore, the income estimation report presents industry payroll trends, key average salaries given to employees by the company, objectives for conducting salary surveys, etc. This competent report also exhibits salary survey questionnaires, interpretation of survey, compare key survey findings with industry highlights, etc. Moreover, the survey report showcases recommendations for determining salary structure, compensation structure, the scope for displaying new compensation guidelines, etc. The PowerPoint presentation highlights annual guaranteed pay AGP, non cash benefits and their description, performance bonuses, increment policy, criteria structure, etc. Likewise, the salary survey report PPT illustrates details for the retention program, long-term pay policy, promotions, other compensation policy, working policy guidelines, and more. Book a free demo with our research team now.
People who downloaded this PowerPoint presentation also viewed the following :
Content of this Powerpoint Presentation
Slide 1: This slide introduces Salary Survey Report. State Your Company Name and begin.
Slide 2: This slide states Agenda of the presentation.
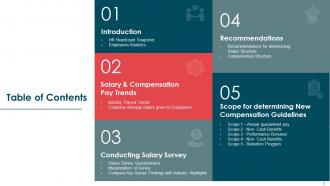
Slide 3: This slide presents Table of Content for the presentation.
Slide 4: This slide highlights title for topics that are to be covered next in the template.
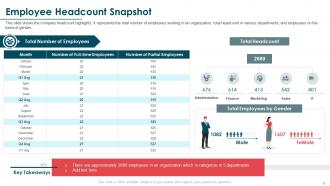
Slide 5: This slide shows the company headcount highlights.
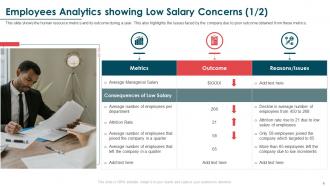
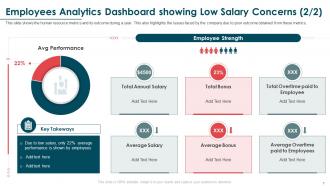
Slide 6: This slide presents Employees Analytics showing Low Salary Concerns.
Slide 7: This is another slide continuing Employees Analytics Dashboard showing Low Salary Concerns.
Slide 8: This slide highlights title for topics that are to be covered next in the template.
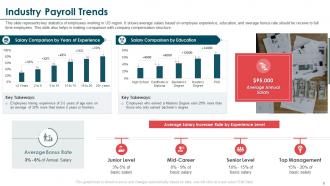
Slide 9: This slide represents key statistics of employees working in US region.
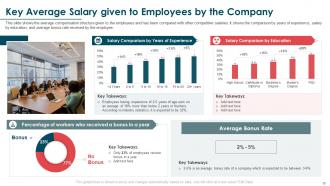
Slide 10: This slide showcases Key Average Salary given to Employees by the Company.
Slide 11: This slide highlights title for topics that are to be covered next in the template.
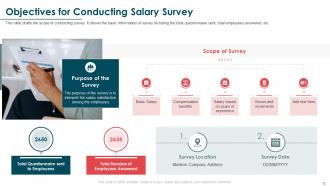
Slide 12: This slide shows Objectives for Conducting Salary Survey.
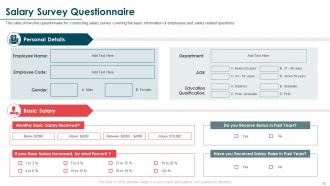
Slide 13: This slide presents questionnaire for conducting salary survey covering the basic information of employees.
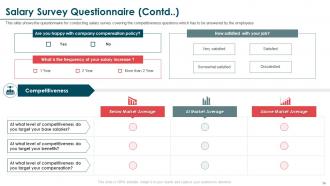
Slide 14: This is another slide continuing questionnaire for conducting salary survey.
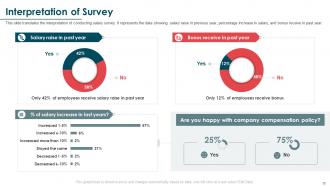
Slide 15: This slide translates the interpretation of conducting salary survey.
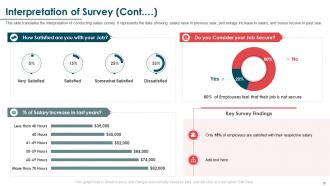
Slide 16: This is another slide continuing interpretation of conducting salary survey.
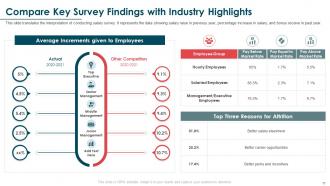
Slide 17: This slide Compares Key Survey Findings with Industry Highlights.
Slide 18: This slide highlights title for topics that are to be covered next in the template.
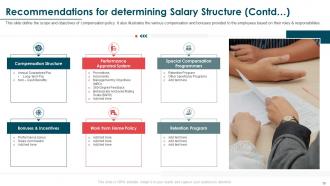
Slide 19: This slide displays Recommendations for determining Salary Structure.
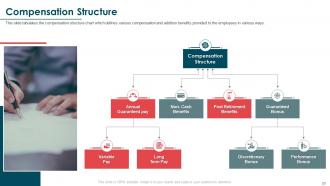
Slide 20: This slide tabulates the compensation structure chart which defines various compensation.
Slide 21: This slide highlights title for topics that are to be covered next in the template.
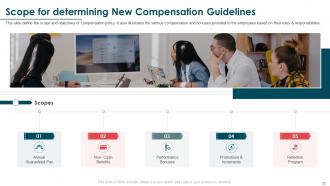
Slide 22: This slide represents Scope for determining New Compensation Guidelines.
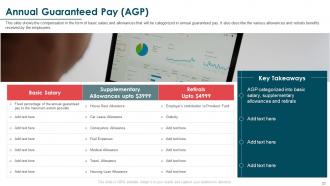
Slide 23: This slide shows the compensation in the form of basic salary and allowances.
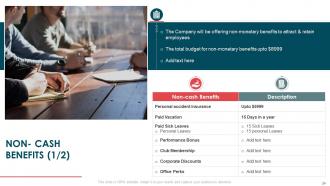
Slide 24: This slide displays non-monetary benefits to attract & retain employees.
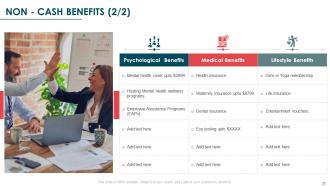
Slide 25: This is another slide continuing non-monetary benefits to attract & retain employees.
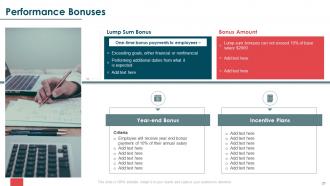
Slide 26: This slide showcases Performance Bonuses.
Slide 27: This is another slide continuing Performance Bonuses.
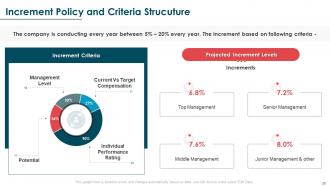
Slide 28: This slide shows Increment Policy and Criteria Strucuture.
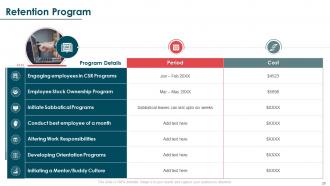
Slide 29: This slide showcases Retention Program with additional textboxes.
Slide 30: This slide is titled as Additional Slides for moving forward.
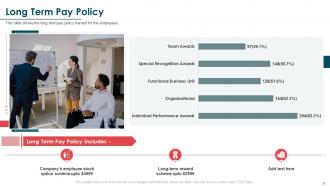
Slide 31: This slide shows the long term pay policy framed for the employees.
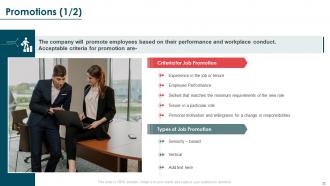
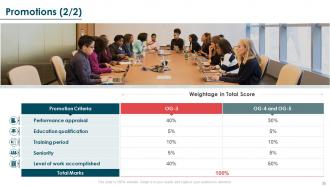
Slide 32: This slide shows Promotions based on Employee performance and workplace conduct.
Slide 33: This is another slide continuing Promotions based on Employee performance and workplace conduct.
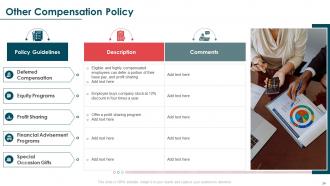
Slide 34: This slide showcases Other Compensation Policy with Policy Guidelines.
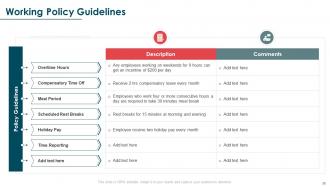
Slide 35: This slide shows Working Policy Guidelines with Brief Introduction.
Slide 36: This slide represents Working Policy Guidelines with related icons and text.
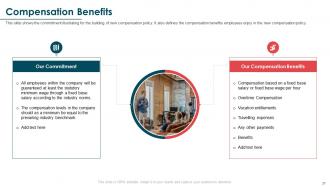
Slide 37: This slide shows the commitment illustrating for the building of new compensation policy.
Slide 38: This is Our Mission slide with related imagery and text.
Slide 39: This is Our Target slide. State your targets here.
Slide 40: This is a Financial slide. Show your finance related stuff here.
Slide 41: This slide shows Post It Notes. Post your important notes here.
Slide 42: This slide depicts Venn diagram with text boxes.
Slide 43: This is a Comparison slide to state comparison between commodities, entities etc.
Slide 44: This slide displays Mind Map with related imagery.
Slide 45: This slide shows Funnel with related icons and text.
Slide 46: This slide presents Roadmap with additional textboxes.
Slide 47: This slide contains Puzzle with related icons and text.
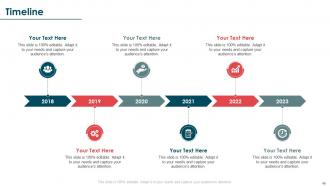
Slide 48: This is a Timeline slide. Show data related to time intervals here.
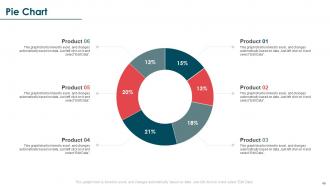
Slide 49: This slide shows Pie Chart with data in percentage.
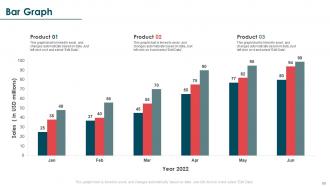
Slide 50: This slide presents Bar chart with two products comparison.
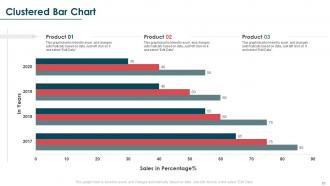
Slide 51: This slide provides Clustered Bar chart with two products comparison.
Slide 52: This is a Thank You slide with address, contact numbers and email address.
Salary Survey Report Powerpoint Presentation Slides with all 57 slides:
Use our Salary Survey Report Powerpoint Presentation Slides to effectively help you save your valuable time. They are readymade to fit into any presentation structure.


FAQs for Salary Survey Report
So they ask for the usual stuff - job title, experience, education, company size, industry, location. Gender and age ranges too. Plus whether you're managing people or not. This year they finally added remote/hybrid/office status which honestly should've been there already. All these details create your "peer group" for comparison. More accurate info = better benchmarking when results drop. Don't skip the geographic part either - that's huge for salary differences.
Location can swing your salary by 20-40% for the same exact job - it's wild how much geography matters. Tech and finance see the biggest gaps. SF and NYC will pay way more than smaller cities, but honestly your rent will probably eat half of it anyway. Manufacturing and healthcare don't vary as much since the work's pretty standardized everywhere. Don't look at national salary averages when you're job hunting, they're basically useless. Check what people in your actual city are making first. Those regional data tables we have will show you what's realistic before you go into negotiations.
Most companies get salary data through employee surveys - either HR runs them internally or they hire third-party consultants who pool data from tons of organizations. You'll also see reports pulling from job boards and government databases, but honestly those are kinda hit-or-miss since the info isn't always fresh. Sample size matters big time here. Some of these surveys are already a year old by the time you actually see them, which is pretty useless. The decent reports mix multiple sources and don't just throw everything together randomly. Pro tip: always check their methodology section first. You'd be surprised how sketchy some of these benchmarking reports actually are.
Honestly, the gap is wild - we're talking entry-level around $40-60k while C-suite execs pull $300k+ easy, sometimes 10x more. What's crazy is how it's not even a smooth climb up. You'll be cruising along as a senior manager, then BAM - director level hits different money-wise. Location matters a ton too, especially in tech cities where the spread gets even more insane. Oh and those exec packages? Don't forget the bonuses and equity on top. If you're thinking career moves, mid-level roles are your sweet spot for negotiating power.
Most comp teams I know just live in Excel for basic salary analysis - it gets the job done. When you need fancier stats like regression modeling, that's when people break out SPSS, R, or SAS. Tableau and Power BI are great for those executive dashboards (they eat that visual stuff up). Oh, and there's specialized tools like PayScale or Radford if your company has the budget. Honestly though? Start with Excel first. Get comfortable with the basics there, then you can always level up to more complex software once you know what you're actually doing.
Honestly? At least once a year, but the market's been crazy lately. I'd probably do it every 12 months minimum just to stay current. Six months might be better if you're in tech or something super competitive - those industries move stupid fast. Don't go overboard though, people get annoyed if you're constantly surveying them. Also random thought but set a calendar reminder now because I always forget this stuff. Nothing worse than realizing your compensation data is like two years old when you're trying to make hiring decisions.
Dude, location makes a HUGE difference in salary benchmarks. You can't just look at SF or NYC numbers and think that applies everywhere - a $120k job in San Francisco might only pay $85k in Austin because everything costs way less there. Most salary surveys break things down by region or have these multiplier things to adjust for different cities. Honestly, some companies get pretty nerdy with cost of living calculators to set their pay ranges. Always filter by your actual metro area when you're researching, otherwise you'll get completely unrealistic expectations that don't match what's actually happening locally.
Oh totally! Those salary surveys are super useful for this stuff. You can stack your company's pay against what everyone else is doing and see if certain groups are getting screwed over. It's way easier to spot patterns when you have that outside data - like if women or minorities keep falling below market rate for the same jobs. Internal stuff gets messy because people have blind spots, you know? Plus having external benchmarks makes your case way stronger when you need to push for changes. Honestly beats trying to argue with just gut feelings and internal comparisons.
Oh dude, don't just look at the base salary number! I made that mistake once and almost got screwed over. The whole package matters - health insurance, 401k matching, stock options, bonuses, all that stuff. Like a $70k job with amazing benefits can actually beat out $80k with crappy coverage. Stock options are kinda tricky to value though, honestly. Always ask them to break down the total compensation before you decide. Trust me, doing the math first will save you from feeling like an idiot later!
So basically, salary surveys show you how your pay stacks up against everyone else - which matters a ton for getting good candidates. Pay too little? You'll lose people to better offers every time. Most companies aren't overpaying (honestly, I wish that was my problem), but if you are, you're just wasting money. The data helps you figure out realistic ranges for each role. I'd definitely use it to double-check any positions where you keep striking out with candidates - might be a pay issue.
Honestly, job titles and descriptions are huge for salary data - that's literally how survey companies sort roles and figure out pay bands. Your title being too vague or your description not matching standard definitions? You'll get weird data that has nothing to do with your actual work. Companies get so creative with titles now (seriously, "Growth Hacker"?), but you need to map back to normal roles for benchmarking. Focus on what you actually do day-to-day rather than just matching titles. Otherwise you're comparing completely different things.
Don't just blindly trust the data - that's the biggest mistake. Check if those survey people actually match your situation: same industry, company size, location. I've watched people compare Silicon Valley tech money to midwest manufacturing jobs which is... yeah, pointless. Small sample sizes will mess you up too. Look at total comp, not just base salary. Oh and the data's probably already 6+ months old when you find it. Cross-check with a few different sources. If something looks totally nuts, it probably is.
Here's what I'd do - grab some salary survey data and see where you're actually at compared to market rates. If you're below that 50th percentile mark, people are gonna start looking around. The surveys also tell you what benefits actually matter (hint: nobody cares about your fancy office perks as much as you think). Once you spot the gaps, focus on the roles where you're really underpaying - those are your flight risks. But honestly, the biggest mistake I see is companies collecting all this data then doing nothing with it. Actually fix your pay structure and tell people about the changes.
Dude, the remote work thing totally flipped tech salaries upside down. Some companies went full location-blind while others still pay based on where you actually live. AI/ML people are making bank right now - like 20-30% jumps year over year, it's honestly wild. Smaller companies can't compete on base salary alone anymore, so they're throwing in crazy equity deals, learning budgets, whatever it takes. Oh and total comp packages are getting super creative now instead of just bumping your base pay. You should definitely check what both local AND remote gigs are paying before you make any moves.
Glassdoor and PayScale are decent starting points for baseline numbers. Just make sure you're looking at similar company sizes - Fortune 500 data won't help much with your 15-person team (trust me on this one). Other small business owners are weirdly candid about pay struggles if you ask. Try joining local business groups or HR association surveys for benchmarking. I'd grab 3-5 different sources per role since one data point can be way off. Oh, and set a reminder to check this stuff quarterly. Small business markets change fast and your numbers can get stale quick.
-
I'm happy to discover your PowerPoint presentations and templates. They met my expectations precisely. Very innovative!
-
Like always a great experience with you guys. Always there on the drop of hat to help.