

Sales And Inventory Management System Flowchart




Try Before you Buy Download Free Sample Product
 Impress Your
 Audience
 100%
100% Editable
 Save Hours
 of Time


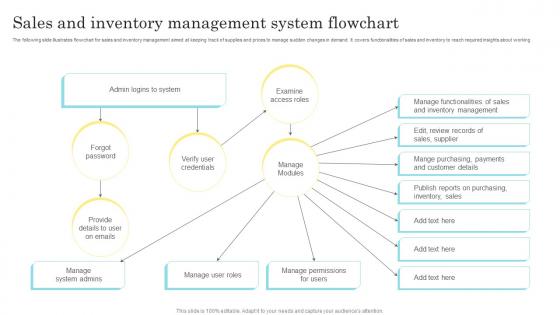
The following slide illustrates flowchart for sales and inventory management aimed at keeping track of supplies and prices to manage sudden changes in demand. It covers functionalities of sales and inventory to reach required insights about working.
People who downloaded this PowerPoint presentation also viewed the following :
Sales And Inventory Management System Flowchart with all 6 slides:
Use our Sales And Inventory Management System Flowchart to effectively help you save your valuable time. They are readymade to fit into any presentation structure.





FAQs for Sales And Inventory
You'll need inventory tracking, demand forecasting, reorder points, supplier lead times, and sales data integration. Most people go crazy with branches though - seriously, I've seen flowcharts that look like spaghetti. Keep it simple: track stock, watch your thresholds, trigger reorders, receive stuff, update records. Don't forget feedback loops so sales can jump in when things go sideways. Oh, and map what you're actually doing first before designing the "perfect" process. That's where you'll spot the real bottlenecks. Decision points should be clear - when to reorder, escalate shortages, or change your purchasing.
Look, a sales inventory flowchart is basically your visual map showing how stuff moves from warehouse to customer. Makes spotting bottlenecks super obvious. You'll see exactly where things get stuck or go missing - honestly saved my sanity when I was tracking down lost shipments last month. The best part? Finding those redundant steps you can cut out. Set better reorder points, automate the manual stuff that's eating your time. Just start by mapping what you're doing now, then hunt for the most annoying pain points first. Trust me, once you see it all laid out visually, the problems jump right out at you.
For sales inventory flowcharts, I'd go with Microsoft Visio if your company's already got Office - it's pretty much the standard. Lucidchart's really nice for collaboration though, super easy to use. Draw.io is free and honestly does way more than you'd expect for zero cost. SmartDraw and Creately work too, or you could even just use PowerPoint if it's something basic. My take? Start with Draw.io since it won't cost you anything. You can always move up to Lucidchart or Visio later once you figure out what you actually need.
Look, it's basically like having a map everyone can actually read. Your sales people know when stuff's coming in, warehouse folks see what's going out - nobody's guessing anymore. Those awkward "wait, wasn't that your job?" conversations? Gone. New people can glance at it and instantly get how they fit in, which honestly saves you from explaining the same thing fifty times. The flowchart shows exactly who handles what and when inventory moves around. Way better than that game of telephone departments usually play. Training gets way faster too since people can see the whole process laid out.
Honestly, the trickiest part is just how many people are involved in your inventory stuff. Procurement, warehousing, sales, finance - they're all doing their own thing. Each department will swear they know exactly how everything works, but then you talk to the next team and get a completely different story. It's wild how disconnected everyone can be. I'd definitely interview each group separately first, then get them all in a room together to figure out what's actually happening versus what's supposed to be happening. That alignment piece is brutal but you gotta nail it before designing anything new.
Monthly updates work best if you can manage it, though quarterly is the bare minimum. Things change fast - new suppliers, seasonal stuff, promotions - and outdated flowcharts are basically worthless. I learned this the hard way when our holiday rush hit and we were still using summer workflows. Major bottlenecks or new product lines? That's when you definitely need to revise. Set a phone reminder because honestly, these updates get forgotten when everything else is crazy busy. The whole point is matching your actual process, not some fantasy version from months ago.
So from those flowcharts you can grab inventory turnover, days sales outstanding, stockout frequency, lead times - the usual suspects. Turnover shows how fast you're moving stuff. DSO is about cash coming in. The visual thing actually helps a ton vs drowning in Excel hell, trust me. You'll spot carrying costs and reorder points too. Oh and safety stock levels. Start with whatever hits your cash flow hardest, then worry about the operational stuff later. That's worked best for me anyway.
So basically, a sales inventory flowchart shows you how products move through your system - and that's pure gold for predicting demand. Track how fast things sell at each stage. You'll spot seasonal trends, see which items fly off shelves vs. sit forever. Honestly, it's way better than guessing what customers want next month. The visual part makes it super easy to figure out restocking timing and quantities. Just map out your current process first, then hunt for those repeating patterns. Once you find them, boom - you've got your forecasting data right there.
Honestly, start simple with clear entry points and just follow how your inventory actually moves. Same symbols and colors throughout - I've watched people get totally lost trying to figure out random shapes and colors. Decision points need obvious yes/no paths, and definitely show who's responsible for each step. Here's the thing though: don't try cramming everything into one massive chart. Break complex stuff into smaller connected ones instead. Also, run it by your team first because they'll spot the weird gaps you missed. Way better than presenting something that makes zero sense to everyone else.
Your flowchart's gonna look totally different depending on which inventory system you're using. FIFO means you need decision points for grabbing the oldest stuff first, while LIFO goes backwards. Just-in-time is honestly pretty cool - the flowcharts end up super clean since you're barely storing anything. Real-time systems like perpetual inventory need update symbols everywhere, but periodic ones just show those big batch updates happening here and there. I'd sketch out your actual process first though, then worry about the flowchart part.
Dude, automation is a game changer for inventory tracking. Your POS system can feed directly into your flowcharts, so you're seeing real stock levels instead of guessing. No more forgetting to update those damn spreadsheets - we've all been there. It'll automatically flag when you need to reorder stuff and catch discrepancies before they blow up. Even connecting just your basic systems beats doing everything manually. The real-time updates alone will save your sanity, trust me. Plus it stops those "wait, how many do we actually have?" moments that make you question everything.
First thing - figure out what's actually different about your industry. Pharmaceuticals need batch tracking and expiration monitoring that clothing stores obviously don't. Food places have temperature controls and FIFO stuff. Map out those unique requirements first. Then grab people from different departments to brainstorm. Warehouse folks will spot things finance totally misses - I've seen this happen so many times. Start with a basic template and build on it. Add your compliance requirements, seasonal quirks, approval processes. Honestly, it's pretty simple once you know what makes your business tick.
Honestly, flowcharts are a game-changer for this stuff. Map out each step visually and you'll see exactly where things get bottlenecked. Look for spots where inventory just sits there or where handoffs between teams drag on forever. I'd start with just one product line - way less overwhelming that way. The visual thing really works because patterns jump out at you that spreadsheets totally hide. It's like finally seeing your whole mess from above instead of being stuck in it. Check those transition points between departments especially hard, that's usually where things fall apart.
Your customers are literally telling you what to stock and when. If they're complaining about stuff being out of stock, bump up your reorder points. Notice they always buy certain things in summer? Adjust your lead times for that. Honestly, it's way better than just guessing what'll sell. Look at their buying patterns, complaints, even return rates - all that feeds back into tweaking your inventory flowchart. The goal is matching what people actually want with what you're ordering, not what looks good on paper.
Stick with the basic shapes - rectangles for processes, diamonds for decisions, circles for start/end. Color coding makes everything clearer, like blue for inventory stuff, green for sales, red for alerts. Top to bottom flow is easiest to follow. Honestly, I've seen too many flowcharts that look like someone dumped a crayon box on them, so don't overdo it. Simple icons help too if you can swing it. Clear fonts matter more than you'd think. Oh, and here's the real test - show it to someone who knows nothing about your process. If they get confused, you know what needs fixing.
-
“As you have innovative ideas and they are all customizable, this saves a huge chunk of your time to prepare well-read presentations.”
-
Good research work and creative work done on every template.