


Presentación de PowerPoint de análisis y enfoque del proceso Six Sigma con diapositivas





Try Before you Buy Download Free Sample Product
 Impress Your
 Audience
 100%
100% Editable
 Save Hours
 of Time


¿Está buscando una muestra PPT del modelo Six Sigma prefabricada completa? ¡No hay problema! Con nuestro análisis de proceso six sigma preconstruido y presentación de PowerPoint de enfoque, tiene la oportunidad ideal de causar una buena impresión en su audiencia. Para ayudar más aquí, estamos compartiendo algunas ideas para usar esta presentación de diapositivas de PowerPoint. Este modelo PPT de proceso six sigma ayuda a poner énfasis en la manufactura esbelta o el enfoque empresarial esbelto para motivar a los empleados a hacer un uso juicioso de los recursos. Además, puede lograr más en su negocio utilizando nuestro archivo de muestra PPT como un mensaje visual simbólico para los empleados para mejorar la calidad, reducir el desperdicio y optar por la formación de equipos. Además de esto, nuestra plataforma de presentación está conceptualizada de manera que retrata varios otros conceptos relacionados como herramientas lean six sigma, six sigma dmaic, metodología dmaic, gestión de calidad total, control de calidad estadístico, diseño para six sigma y muchos más. Entonces, ¿por qué esperar? Descargue instantáneamente nuestro ejemplo PPT exclusivo y lleve sus procesos comerciales y de fabricación al siguiente nivel. Consiga miles de horas de trabajo de diseño en su próxima presentación. Análisis y enfoque del proceso Six Sigma La plataforma completa de PowerPoint con diapositivas está al alcance de su mano a solo unos segundos de distancia.
People who downloaded this PowerPoint presentation also viewed the following :
Contenido de esta presentación de Powerpoint
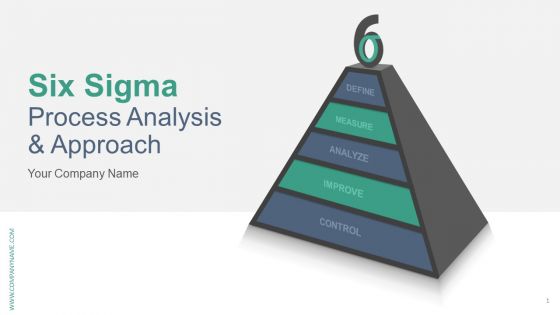
Diapositiva 1 : Esta diapositiva presenta el enfoque y análisis de procesos Six Sigma. Indique el nombre de su empresa y comience.
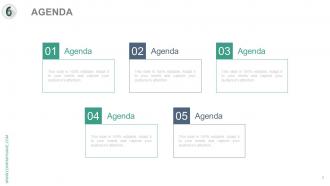
Diapositiva 2 : Esta es una diapositiva de Agenda. Exprese sus agendas aquí.
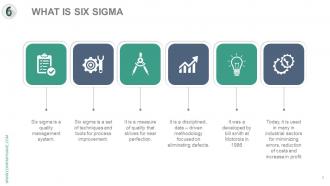
Diapositiva 3 : Esta diapositiva muestra qué es Six Sigma con el siguiente contenido: Six Sigma es un sistema de gestión de la calidad. Six sigma es un conjunto de técnicas y herramientas para la mejora de procesos. Es una medida de calidad que se esfuerza por alcanzar la perfección. Es una metodología disciplinada, basada en datos, enfocada en eliminar defectos. Fue desarrollado por Bill Smith en Motorola en 1986. Hoy en día, se utiliza en muchos sectores industriales para minimizar errores, reducir costos y aumentar las ganancias.
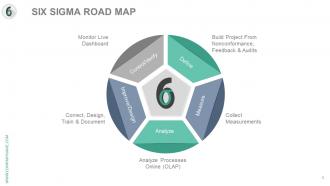
Diapositiva 4 : Esta diapositiva muestra una hoja de ruta de Six Sigma con los siguientes subtítulos: construir proyecto a partir de no conformidades, comentarios y auditorías, monitorear el tablero en vivo, recopilar mediciones, corregir, diseñar, capacitar y documentar, analizar procesos en línea (OLAP) como definir, medir , Analizar, Mejorar / Diseñar, Controlar / Verificar.
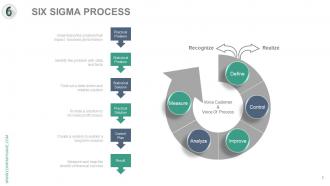
Diapositiva 5 : Esta diapositiva presenta el Proceso Six Sigma con el siguiente contenido: Problema práctico: Comprenda el problema que afecta el rendimiento empresarial. Problema estadístico: identificar el problema con datos y hechos Solución estadística: encontrar una solución confiable y basada en datos Solución práctica: brindar una solución para aumentar las ganancias reducir Plan de control: crear un sistema para sostener una solución a largo plazo Resultado: medir y cosechar el beneficio del éxito financiero como Reconocer Realizar Medir Analizar Controlar Mejorar Definir la Voz del Cliente y la Voz del Proceso.
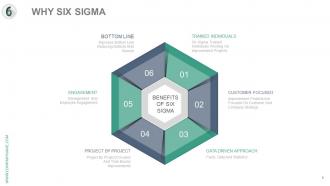
Diapositiva 6 : Esta diapositiva muestra POR QUÉ SEIS SIGMA con el siguiente subtítulo Beneficios de Six Sigma divididos en: Enfoque centrado en el cliente, Enfoque basado en datos, Conclusión, Compromiso, Personas capacitadas, Proyecto por proyecto.
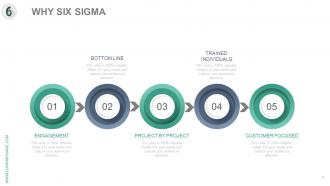
Diapositiva 7 : Esta diapositiva muestra POR QUÉ SEIS SIGMA con los siguientes subtítulos: Enfoque en el cliente, Enfoque basado en datos, Conclusión, Compromiso, Personas capacitadas, Proyecto por proyecto.
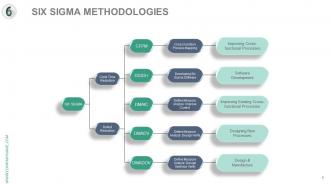
Diapositiva 8 : Esta diapositiva muestra las metodologías Six Sigma que muestran: reducción de defectos, reducción del tiempo de ciclo, CFPM, DSSS + DMAIC, DMADV, DMADOV, diseño y fabricación, diseño de nuevos procesos, mejora de los procesos multifuncionales existentes, desarrollo de software, mejora de los procesos multifuncionales , Mapeo de procesos de funciones cruzadas, Desarrollo de software Six Sigma, Definir Medir Analizar Diseño Verificar, Definir Medir Analizar Diseño Optimizar Verificar, Definir Medir Analizar Mejorar Control.
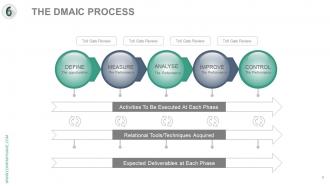
Diapositiva 9 : Esta diapositiva muestra el proceso DMAIC que muestra: Herramientas / técnicas relacionales Adquiridas Resultados esperados en cada fase Actividades que se ejecutarán en cada fase DEFINIR: Las oportunidades MEDIR: El desempeño ANALIZAR: El desempeño MEJORAR: El desempeño CONTROL: El desempeño y el costo Revisión de puerta.
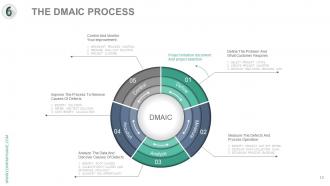
Diapositiva 10 : Esta diapositiva presenta el proceso DMAIC que muestra el documento de inicio del proyecto y la selección del proyecto Definir el problema y lo que requiere el cliente 1. SELECCIONAR EL PROYECTO - CTO's 2. CREAR CARTA DEL PROYECTO 3. DESARROLLAR EL MAPA DE PROCESOS DE ALTO NIVEL Medir los defectos y la operación del proceso IDENTIFICAR LA MÉTRICA DE SALIDA DEL PROYECTO 2. DESARROLLAR EL PLAN DE RECOPILACIÓN DE DATOS 3. ESTABLECER LA LÍNEA DE BASE DEL PROCESO Analizar los datos y descubrir las causas de los defectos 1. IDENTIFICAR LAS CAUSAS RAÍCES 2. VALIDAR LAS CAUSAS RAÍCES Y DETERMINAR ... VITALFEW '' 3. CUANTIFICAR LA OPORTUNIDAD Mejorar el proceso Para eliminar las causas de los defectos 1. IDENTIFICAR LA SOLUCIÓN 2. REFINAR Y PROBAR LA SOLUCIÓN 3. CÁLCULO DE COSTOS Y BENEFICIOS Controle y supervise su mejora 1. IMPLEMENTE EL CONTROL DEL PROCESO 2. PREPARE LA SOLUCIÓN DESPLEGABLE 3. CIERRE DEL PROYECTO Definir, medir, analizar, mejorar, controlar .
Diapositiva 11 : Esta diapositiva explica el PASO 1: DEFINIR.
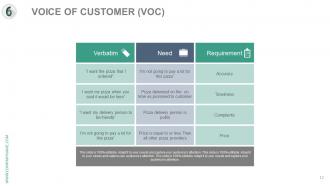
Diapositiva 12 : Esta diapositiva presenta la Voz del cliente con necesidad, requisito, palabra por palabra.
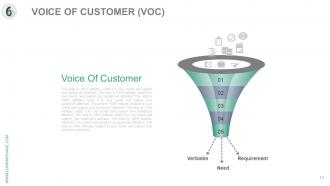
Diapositiva 13 : Esta diapositiva muestra la VOZ DEL CLIENTE (VOC) en forma de embudo.
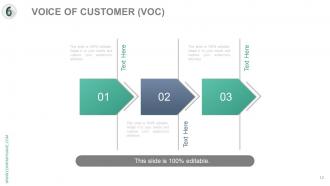
Diapositiva 14 : Esta diapositiva muestra la VOZ DEL CLIENTE (VOC) en forma de flecha.
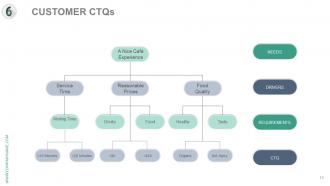
Diapositiva 15 : Esta diapositiva muestra los CTQ de los clientes en forma de jerarquía: REQUISITOS, CTQ, CONDUCTORES, NECESIDADES.
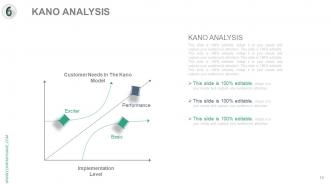
Diapositiva 16 : Esta diapositiva muestra Kano Anlaysis con: Excitador, Rendimiento, Básico, Necesidades del cliente en el modelo Kano, Nivel de implementación.
Diapositiva 17 : Esta diapositiva muestra la Carta del proyecto que muestra: Recursos, Roles de equipo, Proyecto, Hito, Alcance del proyecto, Problema, Declaración, Declaración de metas, Caso de negocio.
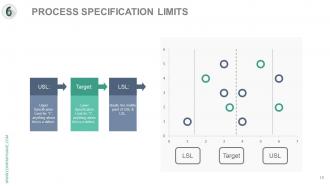
Diapositiva 18 : Esta diapositiva muestra los Límites de especificación del proceso que muestran: LSL USL Objetivo USL: Límite de especificación superior para 'Y', todo lo que esté por encima de esto es un defecto. Objetivo: Límite de especificación inferior para 'Y', todo lo que esté por encima de esto es un defecto. LSL: Idealmente, el punto medio de USL y LSL en forma de gráfico de burbujas.
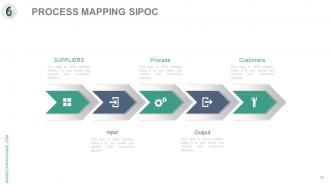
Diapositiva 19 : Esta diapositiva muestra el mapeo de procesos SIPOC con- C- CLIENTE, O- SALIDA, P- PROCESO, I- ENTRADA, S- PROVEEDORES.
Diapositiva 20 : Esta diapositiva muestra Proveedores, Procesos, Clientes, Resultados, Insumos.
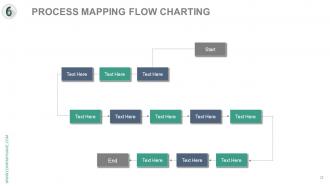
Diapositiva 21 : Esta diapositiva muestra el diagrama de flujo del mapeo de procesos.
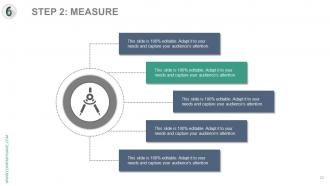
Diapositiva 22 : Esta diapositiva muestra el PASO 2: MEDIR.
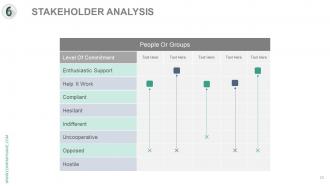
Diapositiva 23 : Esta diapositiva muestra el Análisis de las partes interesadas en forma de tabla.
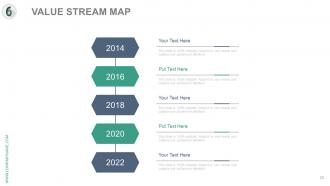
Diapositiva 24 : esta diapositiva muestra un mapa de flujo de valor.
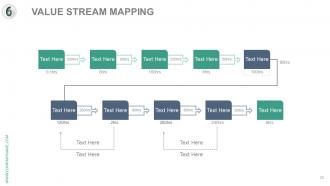
Diapositiva 25 : Esta diapositiva también presenta el Mapeo del flujo de valor.
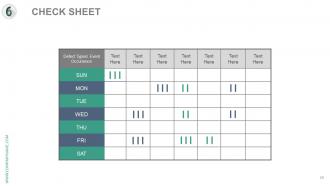
Diapositiva 26 : Esta es una diapositiva de HOJA DE COMPROBACIÓN en forma de tabla.
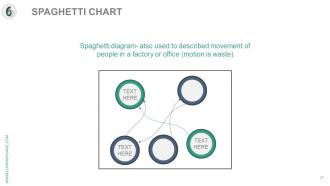
Diapositiva 27 : Esta diapositiva muestra un diagrama de tabla de espaguetis, que también se usa para describir el movimiento de personas en una fábrica u oficina (el movimiento es un desperdicio)
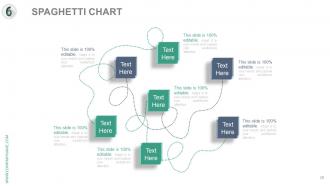
Diapositiva 28 : esta diapositiva muestra una tabla de espaguetis.
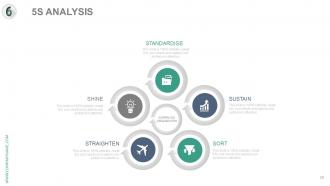
Diapositiva 29 : Esta diapositiva muestra el ANÁLISIS de las 5S, a saber: ENTRAR, ORDENAR, BRILLAR, SOSTENER, ESTANDARIZAR.
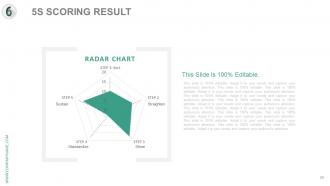
Diapositiva 30 : Esta diapositiva muestra el RESULTADO DE PUNTUACIÓN 5S, a saber: Sostener, Enderezar, Brillar, Estandarizar
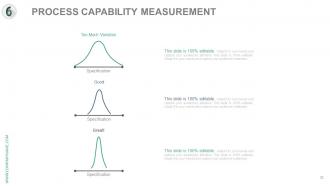
Diapositiva 31 : Esta diapositiva muestra la medición de la capacidad del proceso en forma de gráfico de cresta.
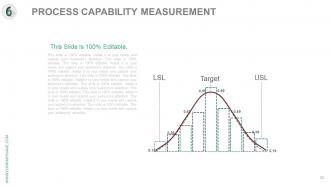
Diapositiva 32 : Esta diapositiva también muestra la medición de la capacidad del proceso en forma de gráfico de cresta que muestra LSL, USL y TARGET.
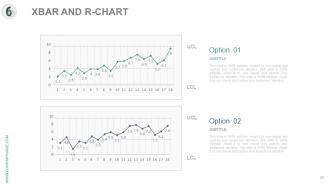
Diapositiva 33 : Esta diapositiva muestra un XBAR Y R-CHART para presentar datos de variables monitoreadas.
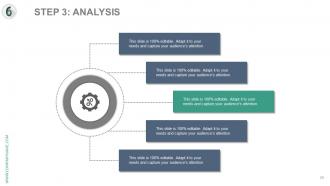
Diapositiva 34 : Esta diapositiva muestra el PASO 3: ANÁLISIS.
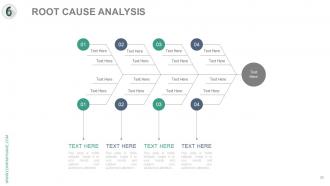
Diapositiva 35 : Esta diapositiva muestra el diagrama de Análisis de causa raíz.
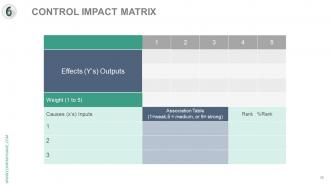
Diapositiva 36 : Esta diapositiva muestra una MATRIZ DE CONTROL DE IMPACTO.
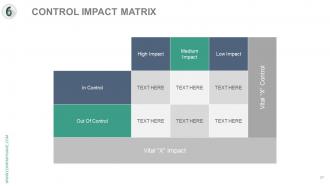
Diapositiva 37 : Esta diapositiva también muestra una MATRIZ DE CONTROL DE IMPACTO.
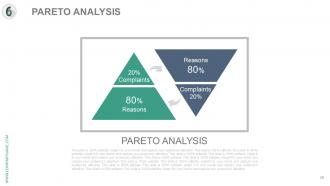
Diapositiva 38 : Esta diapositiva muestra el análisis de Pareto.
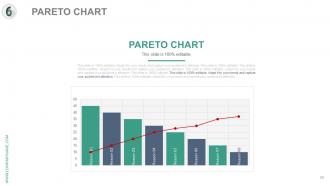
Diapositiva 39 : Esta diapositiva muestra el análisis de diagrama de Pareto en forma de gráfico.
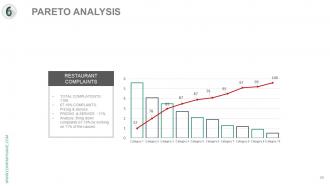
Diapositiva 40 : Esta diapositiva también muestra el Análisis de Pareto en forma de gráfico.
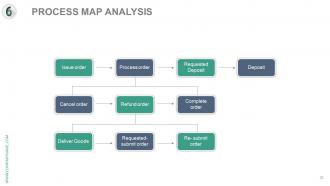
Diapositiva 41 : Esta diapositiva muestra el ANÁLISIS DEL MAPA DE PROCESO mostrando: Emitir orden, Cancelar orden, Entregar mercancías, Procesar orden, Devolver orden, Solicitar: enviar orden, Solicitar depósito, Completar orden, Reenviar orden, Depositar.
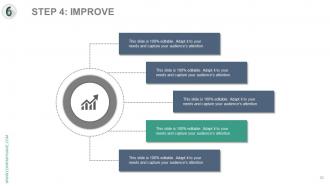
Diapositiva 42 : Esta diapositiva muestra el PASO 4: MEJORAR.
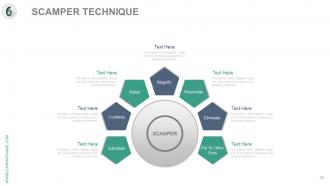
Diapositiva 43 : Esta diapositiva muestra la TÉCNICA DE ESCAMPADOR: Sustituir Combinar Adaptar Ampliar Reorganizar Eliminar Poner a otros usos.
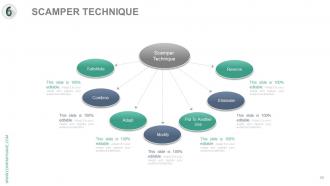
Diapositiva 44 : Esta diapositiva muestra la técnica Scamper que muestra: revertir, eliminar, poner para otro uso, modificar, adaptar, combinar, sustituir.
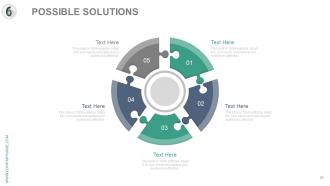
Diapositiva 45 : Esta diapositiva se titula POSIBLES SOLUCIONES en forma de imagen de rompecabezas.
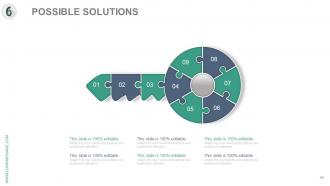
Diapositiva 46 : Esta diapositiva se titula POSIBLES SOLUCIONES en forma de imagen clave de rompecabezas.
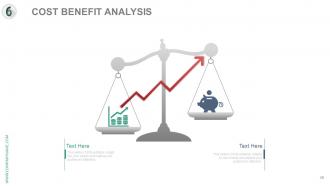
Diapositiva 47 : Esta diapositiva muestra el Análisis de costo-beneficio en forma de imagen de balance.
Diapositiva 48 : Esta diapositiva también muestra el Análisis de costo-beneficio en forma de imagen de balance.
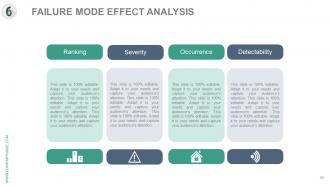
Diapositiva 49 : Esta diapositiva muestra el análisis del efecto del modo de falla que muestra: clasificación, gravedad, ocurrencia, detectabilidad.
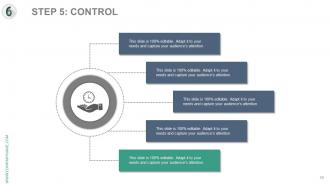
Diapositiva 50 : Esta diapositiva muestra el PASO 5: CONTROL
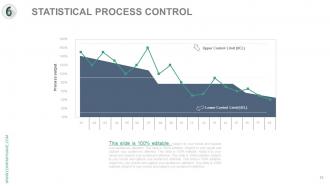
Diapositiva 51 : Esta diapositiva muestra CONTROL DE PROCESO ESTADÍSTICO mostrando: Límite de control superior (UCL), Límite de control inferior (UCL) con salida de proceso.
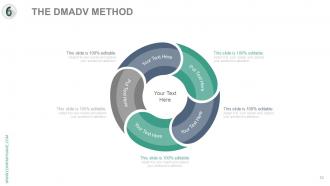
Diapositiva 52 : Esta diapositiva presenta el método DMADV.
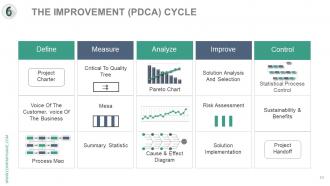
Diapositiva 53 : Esta diapositiva elabora El ciclo de mejora (PDCA) mostrando: Analizar: Diagrama de Pareto, Diagrama de causa y efecto. Mejorar: análisis y selección de soluciones, implementación de soluciones, evaluación de riesgos. Control: Sostenibilidad y Beneficios, Traspaso de Proyectos, Control Estadístico de Procesos. Medida: Estadística de resumen, árbol crítico para la calidad. Definir: Carta del proyecto, Voz del cliente, Voz del negocio, Mapa de procesos.
Diapositiva 54 : Esta es la diapositiva de Nuestra visión. Dígalo aquí.
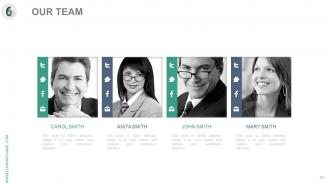
Diapositiva 55 : Esta es la diapositiva de Nuestro equipo con nombre, designación y cuadros de texto para indicar información.
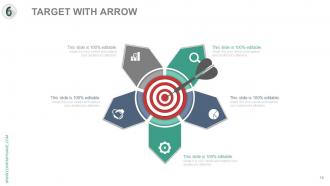
Diapositiva 56 : Esta es una diapositiva de Objetivo con flecha. Indique sus objetivos aquí.
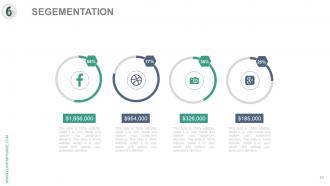
Diapositiva 57 : Esta diapositiva se titula Segmentación para mostrar segmentos de mercado, segmentos de productos, etc.
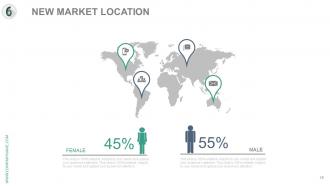
Diapositiva 58 : Esta es la diapositiva de Nueva ubicación de mercado de la imagen del mapa mundial. Marque ubicaciones específicas para el crecimiento de la empresa, el mercado, etc. aquí.
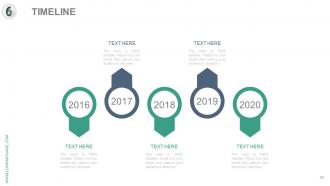
Diapositiva 59 : Esta es una diapositiva de la línea de tiempo para presentar fechas importantes, evolución, hitos, etc.
Diapositiva 60 : Esta es una diapositiva de agradecimiento por reconocimiento con imagen.
Presentación de PowerPoint Análisis y enfoque del proceso Six Sigma con diapositivas con las 60 diapositivas:
La alegría gana terreno con nuestro análisis de proceso Six Sigma y enfoque completo de presentación de PowerPoint con diapositivas. Comienza a fluir un aire festivo.



FAQs for Six sigma process analysis and approach complete powerpoint
Honestly, Six Sigma isn't that complicated once you break it down. Customer focus, data-driven decisions, systematic process improvement - that stuff. Getting your whole team involved matters too. DMAIC is the framework everyone talks about (Define, Measure, Analyze, Improve, Control) and it actually works pretty well for tackling problems step by step. I've seen companies use it everywhere - manufacturing cuts waste, hospitals reduce wait times, banks speed up loan approvals. You just adapt the tools to whatever industry you're in. My advice? Pick one annoying process and try DMAIC on it first. Don't overthink it.
Think of DMAIC like having a game plan instead of just winging it. First you figure out what's actually broken and why customers care. Measure everything with real data - none of that guessing nonsense. Then analyze to find the real root cause, not just surface-level stuff. The improve step is where you test actual solutions. Control makes sure your fix doesn't fall apart later (which honestly happens way too often). It sounds boring but it's surprisingly logical once you try it. Next time don't jump straight to fixing - walk through each step first.
Here's the deal - TQM is basically a company-wide mindset about getting better at everything gradually. Six Sigma? Totally different beast. It's all about the numbers and specific tools to fix problems fast. With TQM, you're trying to get everyone involved and make customers happy through small improvements over time. Six Sigma uses these structured phases (like DMAIC - yeah, I had to look that up once too) and gets super statistical about measuring results. Honestly, if you need concrete tools to work with, Six Sigma's your best bet. TQM requires changing how everyone thinks.
Stats is seriously the foundation of Six Sigma - like, you literally can't improve processes without actually digging into the numbers. DMAIC depends on tools like control charts and hypothesis testing to turn your gut feelings into real proof. I'd honestly start with basic statistical concepts first (sounds boring but trust me). Then jump into the Six Sigma-specific stuff. You'll use stats to measure how things are performing now, spot patterns in variation, and prove your changes actually worked. Without that statistical backbone, you're basically just throwing darts blindfolded and hoping something sticks.
Track your defect rates, cycle times, and cost savings first - that's the bread and butter stuff. Customer satisfaction scores too, obviously. But here's the thing: the cultural shift matters just as much. Are people actually getting certified? Is your team using Six Sigma without you breathing down their necks? Employee engagement tells you if it's really sticking or just going through the motions. Monthly dashboards work great for staying on top of everything. Oh, and make sure you've got solid baseline data from before you started - otherwise you're just guessing if things actually improved.
Honestly, there's a ton of tools but they match up with each phase pretty well. Problem definition uses process maps and VOC analysis. Control charts and measurement system analysis come during the measuring phase. Root cause analysis and fishbone diagrams are huge in the analyze phase - those fishbone ones actually do look like fish skeletons, which is kinda cool. DOE and mistake-proofing happen when you're improving stuff. Then control plans and SOPs wrap things up. Oh, and definitely start with the basics first. I made the mistake of jumping around too much when I started and it just confused me more.
Honestly, the whole Six Sigma training landscape is kinda all over the place. Some providers are obsessed with manufacturing examples, others do service stuff. Time-wise you're looking at anything from crazy 5-day bootcamps to programs stretched over months. ASQ and IASSC are the big names but they've got totally different requirements and exam styles - which is annoying when you're trying to compare. My advice? Figure out what certs your industry actually cares about first. Then check if the provider's examples match what you do day-to-day. Their track record matters too. Don't just pick whoever's cheapest though.
Honestly, the biggest pain is getting people on board - nobody wants change when it feels like more work dumped on their plate. Leadership says they're committed but then gets impatient when projects take months to pay off. Training costs get crazy expensive too, especially with all those belt certifications. Oh, and some companies become total methodology nerds instead of actually fixing business problems (which is kind of missing the point). My take? Pick a couple high-impact projects first. Show some quick wins to get momentum going before you try rolling it out everywhere.
So here's what I'd do - use DMAIC as your backbone but don't let it kill your sprint speed. Six Sigma's great for the data stuff and finding bottlenecks. Agile handles the quick iterations and customer feedback. Honestly, the documentation part of Six Sigma can be a total drag, so keep your metrics light. Try doing PDCA cycles inside your sprints instead of these massive formal processes. Oh, and throw control charts into your retros - that's actually been super helpful for tracking trends. The trick is mixing the quality focus with staying nimble.
So Six Sigma basically fixes all the stuff that makes customers want to scream at your company. You know how frustrating it is when things don't work right? That's what it tackles. Instead of guessing what's wrong, you use actual data to find the real problems. Customers get better products, faster service, less headaches. The whole thing revolves around their feedback too - which honestly makes way more sense than companies just doing whatever they think is best. I'd start simple though. Pick one customer journey, maybe checkout or onboarding, and see where people get stuck.
Honestly, you need both the obvious stuff and the sneaky metrics that catch people off guard. Financial wins are clear - cost savings, revenue bumps, ROI on projects. Process stuff matters too: fewer defects, faster cycle times, happier customers. But here's what trips up most programs - they ignore the people metrics entirely. How engaged are your employees? Are they actually finishing certifications? Do projects stick around after the initial push? I learned this the hard way at my last company. Start small with maybe 3 core metrics instead of going crazy with spreadsheets everywhere.
Honestly, you've gotta show your team this isn't just another flavor-of-the-month thing that'll vanish by Christmas. Jump into projects yourself and make a big deal about celebrating wins - yeah, even the tiny ones. Give people actual time and money to work on this stuff instead of dumping it on their already crazy workload. Start asking "what's the data say?" in meetings. Let people experiment without freaking out if something doesn't work perfectly. Oh, and definitely build continuous improvement into their performance reviews - that's where the rubber meets the road. Show them you're serious about data-driven decisions, not just talking about it.
So Jack Welch's GE is like the poster child for Six Sigma - they literally saved billions in the late 90s rolling it out everywhere. Motorola actually invented the whole thing and used it to fix their manufacturing defects. Amazon's obsessed with it for logistics (honestly explains why my stuff arrives so ridiculously fast). Even Mayo Clinic uses Six Sigma to cut down patient wait times and reduce medical errors. If you're thinking about pitching this at work, these examples show it works pretty much anywhere. Just don't go crazy - start with one process and see how it goes.
Basically, Six Sigma uses data to hunt down what's making your processes inconsistent, then kills those root causes. The whole thing follows five steps - DMAIC they call it. Define your problem, measure everything (and I mean everything), analyze the data, improve the process, then control it moving forward. Most quality issues happen because processes are unpredictable, so when you reduce variation, defects naturally drop. Honestly, just start by mapping out your current process first. Find your biggest headaches - that's where you'll get quick wins and actually see results fast.
Honestly, you can't solve Six Sigma problems with just one department - they're usually way more complex than that. Like if a customer's pissed off, it probably involves sales screwing up the order, operations missing deadlines, AND quality control letting defects slip through. Different people see different pieces of the puzzle. When you mix perspectives, teams catch stuff that would totally fly under the radar otherwise. The implementation goes smoother too because everyone's already bought in from working on it together. Oh, and make sure you actually get people from every area that touches your problem - not just the obvious ones.
-
Excellent template with unique design.
-
Unique and attractive product design.
-
Presentation Design is very nice, good work with the content as well.
-
Great experience, I would definitely use your services further.
-
Great quality slides in rapid time.
-
Top Quality presentations that are easily editable.
-
Unique research projects to present in meeting.
-
Unique research projects to present in meeting.
-
Unique research projects to present in meeting.