

Exemples de présentation de tableau de bord d'achèvement de tâche






Try Before you Buy Download Free Sample Product
 Impress Your
Audience
 100%
Editable
 Save Hours
of Time


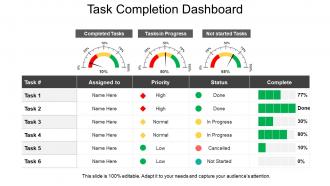
Utilisez ce modèle de présentation du tableau de bord d'achèvement des tâches et gérez vos tâches sans effort. Cela fournit à une organisation un processus de flux de travail efficace. Avec un outil de suivi des tâches approprié, les professionnels peuvent s'assurer que leurs projets se déroulent sans heurts du début à la fin. Gardez une trace appropriée des tâches effectuées afin que, à la fin, vous puissiez déterminer les tâches qui ont été terminées et celles qui sont toujours en attente. Organisez les tâches en fonction de leur statut, des responsabilités qui leur sont assignées et de leur priorité. Vous pouvez également obtenir ce modèle PPT conçu par des professionnels pour répartir les tâches entre les membres de l'équipe. Expliquez comment un travail spécifique doit être effectué et en combien de temps il doit être terminé. La planification faite pour terminer un projet sera inutile si vous n'avez pas mis en place un mécanisme pour suivre l'avancement des tâches. Téléchargez cette mise en page PPT maintenant et hiérarchisez les tâches en fonction de leur importance.
People who downloaded this PowerPoint presentation also viewed the following :
Exemples de présentation du tableau de bord d'achèvement des tâches avec les 5 diapositives :
Oubliez les coûts cachés avec nos exemples de présentation du tableau de bord d'achèvement des tâches. Tous les frais sont clairs comme du cristal.


FAQs for Task completion
Start with progress bars and completion percentages - that visual stuff is huge for keeping everyone motivated. Color-coding priorities is honestly a game changer, makes scanning so much faster. Timeline views help people see what's actually overdue vs coming up soon. Oh, and definitely add filters by person, project, or deadline so everyone can customize their dashboard. Quick action buttons for completing tasks or reassigning them saves tons of clicks. I'd probably skip the fancy features at first - see what your team actually uses, then build from there. These basics will get you pretty far.
Honestly, visuals beat staring at spreadsheets any day. Progress bars show completion percentages at a glance. Red for overdue stuff always works - people notice red immediately. Timeline views help you catch bottlenecks before they become disasters. Kanban boards are solid for tracking workflow stages, and burndown charts show if you're moving fast enough. I always think the trick is picking what matches your team's actual questions. Like if everyone's constantly wondering "are we gonna make it?" then you'll want trend lines and forecasts. Way better than guessing from random numbers.
Start with completion rates - that's your bread and butter metric. How long tasks take and abandonment rates are super important too. Error rates tell you when people are hitting walls, even if they push through eventually. Task complexity scores are gold if you can track them (explains why some stuff takes ages). Break everything down by user type and task category - patterns jump out way faster that way. Oh, and retry attempts! Those are clutch for spotting friction points. Honestly, just nail the completion percentage first then add the fancy stuff once you've got your system dialed in.
Honestly, those dashboards are game-changers for team stuff. You'll stop getting bombarded with "what's happening with that project?" texts because everyone can just peek at the board. Real-time updates mean no more guessing games about who's behind or crushing their deadlines. Nobody wants their tasks sitting there all red and overdue for the whole team to see - trust me, it keeps people moving. You can catch problems early too, like when someone's drowning in work while others have bandwidth. Start basic though. Even something simple like Trello does the trick without all the fancy bells and whistles.
Honestly, I'd just go with whatever your team's already using since most tools have decent dashboard features anyway. Notion and Airtable are super popular - you can customize views and set up filters pretty easily. Asana's solid too. If you want something dead simple, Trello works fine. Monday.com is built specifically for this kind of project tracking stuff. For the data nerds out there, Google Sheets with some conditional formatting can work wonders, or you could go full fancy with Tableau or Power BI. But seriously, start simple and see what sticks.
Dude, real-time data is a game changer for dashboards. You'll actually see what's happening NOW instead of staring at yesterday's mess. Stuck tasks? Overloaded teammates? You'll spot it instantly. My old boss used to say it's like project x-ray vision (cheesy but true). The best part? You can fix problems before they blow up deadlines. Hook your project tools directly into the dashboard so everything updates automatically - saves you from manually refreshing stuff all day. Trust me, once you see bottlenecks forming in real time, you can't go back to static reports.
User experience can make or break these dashboards, honestly. Clean visual hierarchy is huge - people need to immediately see what requires their attention. Don't cram everything onto one screen (I've made this mistake before). Put your most critical metrics upfront and keep navigation simple. The whole point is making task completion feel rewarding instead of tedious. Short sentences work. Longer ones should flow naturally when you're explaining complex stuff. Ask users what they want to see first when logging in - that's your starting point right there.
Honestly, it all comes down to picking metrics that actually matter for your specific field. Healthcare dashboards should track things like appointment completions, medication rates, discharge times - basically anything affecting patient care directly. IT folks need different stuff: ticket resolution, system uptime, deployment success rates. The presentation matters too. Healthcare might use red alerts for critical patient tasks, while IT prioritizes by how many users are affected. I'd say start by figuring out what performance indicators your industry really cares about, then design your dashboard views around those workflows. Makes way more sense than trying to force generic templates.
Honestly, I'd stick with bar charts and progress bars for this - they just make sense to people right away. You can show completion percentages, compare how teams are doing, track stuff over time. Gantt charts are solid too if you need the whole timeline view with deadlines, but man they get cluttered fast when you have a million tasks. Don't even bother with pie charts for this kind of data. They're awful. For dashboards that update live, mix it up: progress bars for individual tasks, then maybe a stacked bar for the big picture project health. Start basic with whatever your team actually looks at every day.
Oh, those dashboards are honestly a game-changer for this stuff. You can literally see where everything gets jammed up - like when tasks sit forever in "review" but zoom through development. Pretty telling, right? Check for patterns over time and notice which people or task types always seem to slow things down. I usually set up alerts when tasks sit idle too long, maybe a day or two past normal? That way you can jump in before it becomes a real mess. The visual flow makes bottlenecks super obvious once you know what to look for.
Automate your data feeds first - updating stuff manually is such a pain. I'd do weekly check-ins to see what metrics actually matter and toss the useless ones. Focus on leading indicators so you can fix things before they explode. Your team should help decide what to track since they'll catch things you miss (plus they're more likely to actually use it if they helped build it). Oh and don't get too attached - dashboards need to change as your projects evolve. I learned that one the hard way.
Mobile access is seriously a lifesaver for remote teams. People can update stuff during their commute or approve things while they're out getting lunch - you know, without being stuck at their desk all day. Response times get way faster, and it helps with the whole time zone mess too. Plus no more waiting around for someone to get back to their computer to move things forward. Oh, and make sure your dashboard actually works well on phones because honestly, some of them are terrible on mobile. Your team will definitely appreciate being able to stay in the loop wherever they are.
Ugh, honestly the biggest pain will be getting everyone's messy data to play nice together. Marketing's probably using some fancy tool, dev team's on Jira, and half your colleagues are still living in Excel hell. You'll waste so much time just getting people to update their stuff consistently - it's like herding cats. Plus the whole political nightmare of deciding what metrics to show and who sees what. Trust me, don't try to fix everything at once. Pick a couple teams who actually want to help, show them it works, then slowly drag the rest kicking and screaming. Way less headache that way.
Honestly, feedback loops are what separate dashboards people actually use from expensive digital wallpaper. Ask your team what metrics they care about and what's confusing them. I'd start with just three people - see what they'd change about your current setup. Maybe do quick weekly check-ins or throw up a simple feedback form. You'll be surprised how much they'll tell you about what's actually helping them spot problems versus what's just... there. The whole point is making something that helps them prioritize work, not just look impressive in meetings. Keep tweaking based on what they say.
A bunch of big companies are crushing it with these dashboards. Atlassian cut their delivery delays by 30% tracking sprint progress - pretty solid results. Spotify's squad setup for monitoring feature rollouts is honestly genius (I'm slightly obsessed with how clean their interface looks). HubSpot went the customer success route, using dashboards to track client onboarding tasks and their retention rates jumped. What's cool is they all zeroed in on specific workflows instead of trying to track everything. Don't overcomplicate it - just pick your team's biggest pain point and build something simple around that first. You can always expand later.
-
Excellent template with unique design.
-
Easy to edit slides with easy to understand instructions.