

Weekly Project Status Report For Performance Measurement




Try Before you Buy Download Free Sample Product
 Impress Your
 Audience
 100%
100% Editable
 Save Hours
 of Time


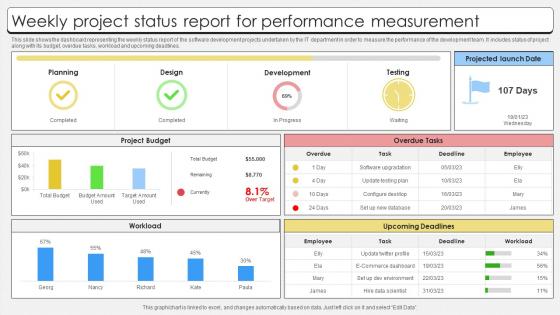
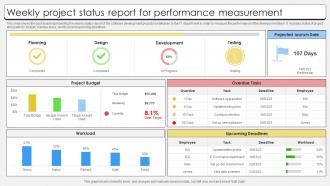
This slide shows the dashboard representing the weekly status report of the software development projects undertaken by the IT department in order to measure the performance of the development team. It includes status of project along with its budget, overdue tasks, workload and upcoming deadlines.
People who downloaded this PowerPoint presentation also viewed the following :
Weekly Project Status Report For Performance Measurement with all 7 slides:
Use our Weekly Project Status Report For Performance Measurement to effectively help you save your valuable time. They are readymade to fit into any presentation structure.





FAQs for Weekly Project Status Report
Pick KPIs that actually match what you're trying to achieve - sounds obvious but you'd be surprised how many people don't do this. Revenue growth and profit margins are no-brainers. Customer satisfaction and retention rates? Super important because they show if people actually like what you're selling. Don't ignore employee stuff either - high turnover is expensive and kills morale. I'd also track some operational metrics like productivity or how long processes take. Honestly though, less is more here. Choose maybe 5-6 that really matter and actually look at them regularly instead of creating some fancy dashboard that nobody checks.
First figure out what actually matters in your specific industry - this stuff varies wildly. Like, manufacturing cares about efficiency and defect rates. SaaS? It's all churn and customer acquisition costs. Healthcare focuses on patient outcomes (obviously). Map out what makes or breaks companies in your space, then find metrics that predict those things. Honestly, don't just steal frameworks from other industries, even if they're crushing it. A retail KPI system won't work for tech. Start with your industry's critical factors and work backwards from there.
Dude, real-time data is a total game changer for tracking performance. You catch problems right when they happen instead of finding out weeks later when you're screwed. It's like having GPS vs. wandering around with some crumpled paper map, you know? Set up automated alerts for your most important metrics so you're not glued to dashboards all day - honestly, who has time for that? Small issues won't snowball into disasters if you spot them early. Just pick your top 3-5 KPIs that actually matter and start monitoring those. You can always expand later.
Honestly, don't pick between them - use both. Start with your hard numbers as the foundation. Sales up 20%? Great. But then dig deeper with actual conversations - maybe those customers are buying but hate the experience. I always do quick surveys or grab coffee with clients to get the real story. Sometimes the best insights come from random comments, not formal feedback. Short version: let the numbers show you what's happening, then talk to people to figure out why. That's when you can actually fix stuff instead of just celebrating good metrics.
Honestly, most people try to track way too much stuff and just get overwhelmed by all the numbers. Companies love picking metrics that are super easy to measure - like how many emails got sent - instead of anything that actually tells you if customers are happy. And once people know what you're tracking, they'll totally game it (been there, seen that). Plus organizations keep switching their metrics around every few months, which is kinda pointless. My take? Pick maybe 3-5 things that really connect to your main goals. Then stick with them long enough to actually see patterns emerge.
Honestly, when people can actually see how their work makes a difference, they start caring way more. Performance measurement gives that visibility - suddenly employees aren't just spinning wheels, they're seeing real impact. Yeah, the accountability part can feel weird at first (nobody loves being measured), but transparency beats guessing where you stand. Let them help set their own goals though - that's huge for buy-in. Otherwise you're just the boss with a clipboard judging everyone. And measure stuff that actually moves the needle, not just random busy work that looks productive but doesn't matter.
Honestly? Start with Google Analytics for web stuff and maybe Tableau or Power BI for dashboards. DataDog's great if you need real-time monitoring - though that might be overkill depending on your setup. Here's the thing though - I've watched so many teams try to track literally everything and just burn out. Pick like 3-5 metrics that actually move the needle for you. Use whatever tools you already have first, then upgrade when things get messier. The tool that matters is whichever one your team won't ignore after two weeks.
Honestly, most companies mess this up by not even knowing what they're actually trying to achieve first. Start there - get crystal clear on your goals. Work backwards from those to find metrics that actually matter. I've watched so many teams obsess over numbers that look impressive but don't change anything meaningful. Every metric should connect directly to something strategic, period. Oh and do quarterly reviews to see if stuff still makes sense - priorities shift faster than people think. My rule? If you can't explain why a metric matters in one sentence, drop it. Vanity metrics are such a waste of time.
I'd check them monthly if I were you. Quarterly feels too long - by then you've missed stuff that could've been fixed earlier. Monthly lets you catch trends before they get weird, plus you'll notice if people start gaming the numbers (which always happens eventually lol). Save the big picture stuff for quarterly though - like whether your metrics actually make sense for what the business wants. Weekly reviews sound intense unless you're at some crazy fast startup. Just don't go longer than three months without looking at them or you'll be flying blind.
You can't improve what you don't measure - sounds cliche but it's true. Without data, you're basically flying blind and hoping stuff gets better. I learned this the hard way at my last job. Metrics give you a starting point and show if your changes actually work or if you're wasting time. Pick maybe 2-3 numbers that really matter to your goals, not just random stats. The tricky part is choosing the right ones - revenue's obvious, but sometimes customer response time or error rates tell a better story. Data also helps you catch new problems before they blow up.
First thing - figure out what metrics actually move the needle for your goals, not just the easy stuff to track. Check what competitors are doing, but honestly your own past data is way more useful since it's your actual situation. I'd aim for maybe 10-20% better than last time - realistic but still pushes you. Oh and keep measuring things the same way or you'll be comparing random stuff later. Pick like 3-5 solid benchmarks max. Trust me, tracking everything just makes you crazy and you won't focus on what matters.
Honestly, your company culture is what makes or breaks performance metrics. I've watched teams waste tons of time gaming dashboards instead of actually fixing problems - it's wild how creative people get when they're scared of blame. The opposite happens when you build trust though. People start using those same numbers to genuinely improve things. You need that psychological safety where reporting bad news doesn't get you in trouble. Leadership has to celebrate smart decisions, not just pretty charts. Here's what I'd do: watch how your team reacts next time metrics look rough. Their response tells you everything about whether this stuff will actually work.
Look, tracking the right stuff shows you what's actually broken vs what you *think* is broken. Response times, how fast you solve problems, where customers get stuck - that's the good data. Way better than finding out through furious customer emails (been there). Honestly, most companies measure the wrong things anyway. Focus on what bugs your customers most, not just internal metrics that make you feel good. Get their feedback first, then track those specific pain points. Once you've got real numbers, you can fix what'll actually move the needle for them.
Honestly, the biggest thing is making sure you're not screwing over certain groups with your metrics. Like don't pick measurements that only work well for extroverts or whatever. Be transparent about what you're tracking - people hate finding out later they were being judged on stuff they didn't know about. Also check if your metrics actually help performance or just make people game the system (which happens way more than you'd think). Oh and definitely get different people to look at your approach regularly. Fresh eyes catch the blind spots you'll miss when you're too close to it.
Honestly, you've gotta match your audience - execs just want the big picture dashboards with key metrics, but department heads need the detailed stuff they can actually do something with. Charts beat spreadsheets every single time (learned this the hard way). Keep visuals simple, show clear trends, and always explain what the numbers actually mean. Oh and stick to a regular schedule - monthly, quarterly, whatever works. People trust consistency. The real trick? Focus on the "so what" instead of just dumping raw data on them. Nobody cares about numbers without context.
-
SlideTeam never fails to surprise me with its amazing PPT designs. Thanks team for providing me with your constant support!
-
Best way of representation of the topic.