


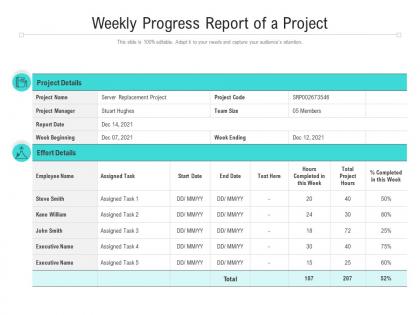
Weekly progress report of a project




Try Before you Buy Download Free Sample Product
 Impress Your
 Audience
 100%
100% Editable
 Save Hours
 of Time


Our Weekly Progress Report Of A Project are topically designed to provide an attractive backdrop to any subject. Use them to look like a presentation pro.
People who downloaded this PowerPoint presentation also viewed the following :
Weekly progress report of a project with all 2 slides:
Use our Weekly Progress Report Of A Project to effectively help you save your valuable time. They are readymade to fit into any presentation structure.
FAQs for Weekly progress report
A thorough project progress report should include current milestone status, budget variance analysis, timeline adherence, risk assessments, resource allocation updates, and stakeholder communication summaries. These components enable project managers to maintain transparency, identify potential bottlenecks early, and ensure strategic alignment, with many organizations finding that comprehensive reporting ultimately delivers improved project outcomes and enhanced stakeholder confidence.
Visual aids enhance project progress reports by transforming complex data into digestible charts, graphs, timelines, and dashboards that stakeholders can quickly interpret and act upon. Through strategic visualization, project managers deliver clearer milestone tracking, resource allocation insights, and risk identification, while reducing meeting times and improving decision-making speed, ultimately enabling faster project delivery and stronger stakeholder alignment.
Effective project progress metrics include schedule variance, budget utilization, milestone completion rates, resource allocation efficiency, and stakeholder satisfaction scores. These indicators enable organizations across sectors like construction, healthcare, and financial services to identify bottlenecks early, optimize resource distribution, and maintain strategic alignment, ultimately delivering enhanced project outcomes and competitive advantage.
Project progress reports should typically be generated weekly for active projects, with monthly summaries for senior stakeholders and daily updates during critical phases or deadlines. The frequency depends on project complexity, stakeholder requirements, and organizational culture, with many project managers finding that consistent weekly reporting strikes the optimal balance between maintaining transparency and avoiding information overload, ultimately enabling better decision-making and stakeholder engagement.
Project progress reports are most impactful when they combine visual dashboards with concise written summaries, leveraging charts, graphs, and key metrics to communicate status at a glance. This strategic combination enables stakeholders to quickly assess project health, identify bottlenecks, and make informed decisions, with many organizations finding that visual formats accelerate decision-making while written details provide necessary context for strategic planning.
Project progress reports can be tailored by adjusting detail levels, focus areas, and presentation formats to match audience needs and decision-making responsibilities. For team members, reports emphasize technical specifics, task dependencies, and operational challenges, while executive versions focus on strategic milestones, budget variance, and risk implications, ultimately enabling targeted communication that enhances project transparency and stakeholder engagement.
**INPUT**: What tools or software are recommended for creating engaging project progress reports? **OUTPUT**: Recommended tools include Microsoft Project, Asana, Trello, Tableau, and PowerPoint, each offering different visualization and collaboration capabilities. These platforms streamline reporting by automating data collection, creating interactive dashboards, and enabling real-time updates, with many project managers finding that visual storytelling tools ultimately enhance stakeholder engagement and decision-making processes. **Word count: 54 words**
Project managers can effectively balance successes and challenges by structuring reports with clear achievement sections followed by obstacle identification, using data-driven metrics to support both positive outcomes and areas needing attention. This approach enables stakeholders to celebrate progress while strategically addressing roadblocks, with many organizations finding that transparent reporting ultimately strengthens team accountability and accelerates project delivery.
Feedback helps identify gaps in communication clarity, data accuracy, stakeholder needs, and reporting frequency within project progress reports. Through systematic feedback collection, project managers can enhance report structure, improve metrics relevance, and streamline information delivery, with many organizations finding that iterative feedback loops ultimately deliver more actionable insights and stronger stakeholder engagement.
Storytelling transforms project progress reports by creating narrative arcs that connect milestones, challenges, and achievements into cohesive journeys that stakeholders can follow and understand. Through compelling narratives, project managers can illustrate how obstacles were overcome, highlight team contributions, and demonstrate value delivery, with many organizations finding that story-driven reports increase stakeholder engagement and support.
Common pitfalls include lack of specific metrics, overly technical language, missing risk assessments, inconsistent formatting, and vague status updates that obscure actual progress. These issues undermine stakeholder confidence and decision-making capabilities, with many organizations finding that clear, data-driven reports with standardized templates enhance transparency, accountability, and ultimately deliver better project outcomes and stakeholder alignment.
Templates streamline project progress reporting by providing standardized formats, predefined sections, consistent metrics, and automated data fields that eliminate repetitive setup work. Through structured frameworks, project managers can focus on analysis rather than formatting, reduce preparation time significantly, and ensure stakeholder consistency, while teams across organizations find that standardized reporting enhances communication and accelerates decision-making processes.
A project progress report aligns with project management methodologies by incorporating their specific frameworks, terminology, metrics, and reporting cycles, whether following Agile sprints, Waterfall milestones, or hybrid approaches. These reports enhance methodology effectiveness by tracking designated deliverables, maintaining consistent stakeholder communication protocols, and ensuring progress measurements reflect the chosen framework's success criteria, ultimately strengthening project governance and strategic oversight.
Project progress reports address risks by incorporating risk assessment matrices, mitigation timelines, contingency planning, and stakeholder impact analysis throughout project phases. Through systematic risk documentation, project managers can identify potential bottlenecks, resource constraints, and timeline deviations early, while implementing proactive mitigation strategies, ultimately delivering enhanced project visibility and reducing costly delays.
Best practices for presenting project progress reports include preparing visual dashboards, structuring updates with clear milestones, highlighting key achievements and challenges, providing actionable next steps, and allocating time for stakeholder questions. These approaches enhance meeting effectiveness by streamlining communication, maintaining stakeholder engagement, and ensuring alignment across teams, with many organizations finding that structured progress presentations ultimately deliver improved project transparency and faster decision-making.
-
Innovative and Colorful designs.
-
Good research work and creative work done on every template.
-
Illustrative design with editable content. Exceptional value for money. Highly pleased with the product.