





 0 Comment
 Customer Reviews

Launching a new product is a challenge that requires everyone in the team to follow what is happening and review useful reports. The implementation of our Top 10 Product Launch Dashboard Templates comes to your rescue. With these templates, get access to important tools such as the Go-to-Market Dashboard, Launch Performance Tracker and Product Rollout Monitor to help manage all the phases of the launch closely.
For a better look at KPIs, view our Top 10 Product Launch KPI Templates with examples and samples for the most important metrics.
To improve performance, every sample focuses on either analyzing marketing campaigns in Launch Campaign Dashboards or highlighting spikes in revenue in Sales Launch Trackers. Both the Product Introduction Panel and Marketing Launch Overview help to fully document the process. Thanks to data insights, companies can help product managers, marketers, and strategists create products that succeed and are deemed milestones.
Want to see everything mentioned clearly? Explore our leading Top 10 Product Dashboard Templates.
Template 1: Product Launch Team Performance Dashboard New Product Release Management Playbook
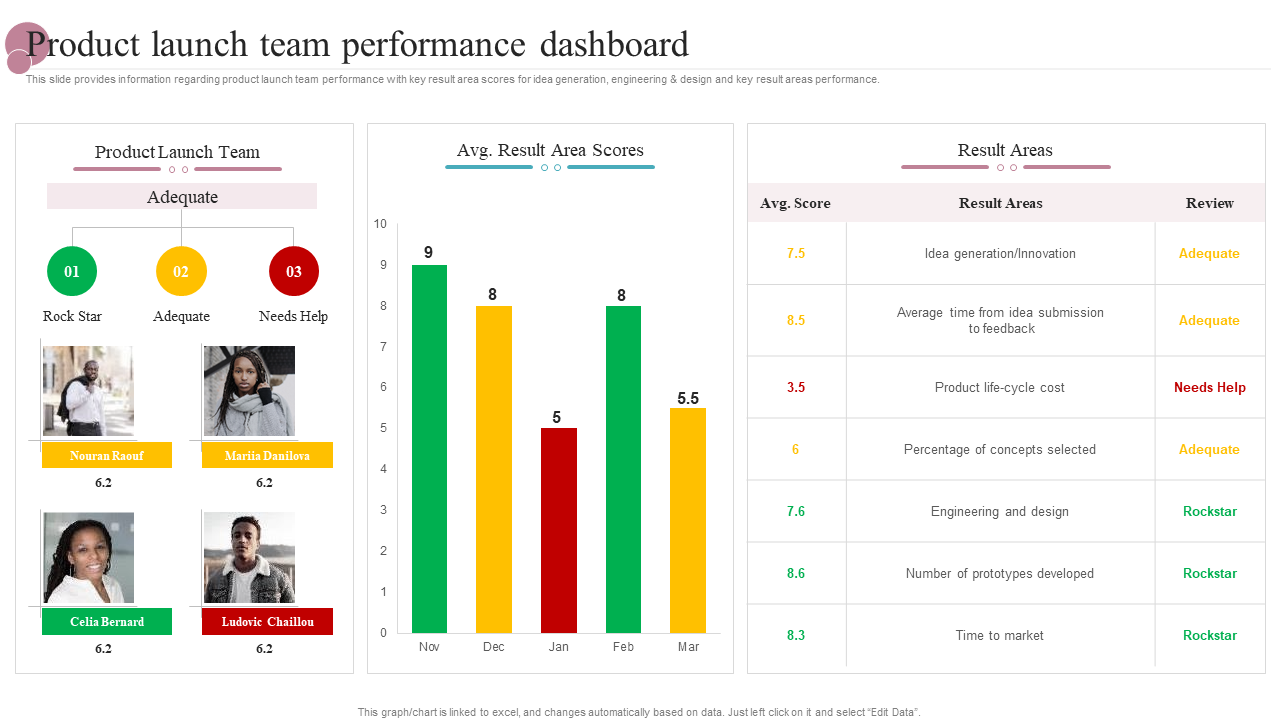
It highlights how the product launch team is doing against different vital performance measures. All employees are placed in one of three groups;Rock Star, Adequate or Needs Help;using their average scores. A main feature is a colour-coded chart that represents the change in how well targets were executed by month. The slide on the right organizes key result areas like innovation and engineering as well as the time required for customers to see new products, showing their average evaluations and tags. The complex design not only lets us know the provider but also indicates if they have higher than expected lifecycle costs. In short, it helps us turn data into real steps by identifying the right spots to intervene and strengthen our approach to success.
Template 2: Execution plan for product launch dashboard to track product launch effectiveness
This slide shows the success of a product launch by looking at major marketing and sales measures. The highest circle in the chart breaks down the budget, the money already assigned to offline or online campaigns, and the budget still in reserve. The most important metrics for the brand are total impressions, the number of trial bookings and units sold for each sale. The report includes two horizontal charts outlining impressions and trial bookings by type of campaign;with online and offline shows campaigns. The structured approach makes it easier to determine which channels matter most for marketing purposes.

Template 3: Product Launch Activities Tracking Dashboard Product Launch Kickoff
With this dashboard, track how everything related to the product launch is going, using important metrics such as the budget, the level of risk, the team’s workload and the tasks still to be done. It shows which parts of planning and design have been finished but also indicates that some risks are still outstanding, some activities are late, and there are differences in budget use among the team. Status icons and color-code on risks allow you to review the current progress and find warning signs quickly. The dashboard also separates work by operational groups and highlights any major imbalances that may need additional support.

Template 4: Product Launch KPI Performance Dashboard
Here is a dashboard to help you monitor and analyze the outcome of a product launch. It highlights KPIs such as how many units were sold, the revenue recorded, the typical unit price, how many customers were reached and the status of the market as a whole. Moreover, tracking the company’s product mix and its share of the market tells us how the portfolio is performing and how competitive it is. Another section on the slide looks at what drives quarterly changes in market share.

Template 5: Food Product Launch Task Management Dashboard
The dashboard presents all the main tasks involved in launching a food product with structure and order. This slide highlights main metrics, such as the number of food taste events and the shops that were covered, and also explains how far each team member has come with their tasks. Every task is noted by its status, whether it’s done, being worked on, not even begun or flagged for prioritization or connections to other tasks. There is also a progress bar that lets you see how complete your course is. Each team member has a progress chart, which helps make sure that everything stays organized and everyone is accountable. With the launch readiness dashboard, product managers and launch teams can easily watch, handle and simplify all tasks connected to launching foods.

Template 6: B2B Product Launch Campaign Performance Dashboard
This is a template that provides you with a detailed overview of how a company performs its B2B product marketing. The slide shows various KPIs to evaluate how well a campaign is performing;including impressions, clicks, acquisitions, click-through rate and ROI. Information on how much is being spent per click and acquisition is provided, along with a look at how the spending compares to the budget. The graph separates CPA, CPC, budget vs. spend and CTR by the five individual campaigns. Download now!

Template 7: Product Launch Marketing Plan Dashboard with Data Analytics
Use this template to understand the entire process of your product’s market introduction. It collects significant marketing measures like the number sold, revenue earned and ASP, making it easier to base decisions on data. The dashboard makes it possible to track which products are succeeding by listing the quarterly changes in consumer tastes and the popularity of devices. The dashboard goes beyond sales data to compare the brand’s market share to that of its competitors, which adds a valuable understanding of where the company stands compared to the competition. The dashboard helps marketers improve the performance of their products by joining sales info with details on product mix and market share. The dashboard makes it easy to see the plan’s results and makes decisions faster by using current statistics.

Template 8: Product Launch Team Performance Dashboard Presentation Display
It summarizes how the team performs when it comes to innovation, engineering and preparing for the launch. With scores by average result area shown month-wise, the dashboard facilitates judging if teams are consistent and locating problem areas. Individual team performance is studied, and the team assesses whether someone is a rock star, performs adequately or needs improvement. This marketing dashboard points out that engineering and design, prototype building and quick time to market are all regions of high achievement. The company is also working to improve its management of product life cycle costs. These insights allow managers to enhance how productive their work is and improve their strategies. In the end, this marketing plan dashboard, supported by data analytics or post launch data analytics, improves performance reviews and makes sure the team is following the same launch goals.

Template 9: Product Launch Activities Tracking Dashboard One Pager Sample Example Document
The launch execution dashboard offers a summary of major project information, concentrating on spending, delayed tasks, how team members are assigned, and risk assessment;on top of that, readable indicators separate items by risk and good health, providing a concise snapshot of known risks and the current budget figures. It points out all overdue tasks, names the team involved, and indicates when the work is scheduled. The centre section provides bar charts showing employee budget and usage information and also displays a graph illustrating departmental workload by type. The software shows progress through various stages: planning, designing, developing, and testing, each with its icon. The dashboard finishes by displaying a planned launch date and a bar showing how much of the project has been done. It’s a consolidated and clear view for tracking project progress.

Template 10: Product Launch Team Performance Dashboard One Pager Sample Example Document
The launch KPI dashboard gives a clear visual picture of the main team results in areas vital to the launch. Key metrics, such as idea generation, engineering design, and important results areas, are highlighted, sharing details about the group’s strong points and weak points. You can compare students’ results by looking at the bar graph, which shows the average score in every result area. The summary table that follows the graph includes the different result areas, their average marks, and a basic review of each. The easy-to-read list enables stakeholders to quickly find the strengths and weaknesses of the team, which can help improve how efficiently things are done.

Final Word
A great dashboard plays a key role in a successful product launch, and our list of the top 10 templates gives you an edge. All of these templates, such as the Go-to-Market Dashboard and Launch Performance Tracker, help add clarity and accuracy to your plans. Whatever you use, from New Product Metrics to a Product Rollout Monitor or a Launch Readiness Dashboard, each tool is important. With tools like the Time-to-Market Tracker and Launch Campaign Dashboard, teams are able to move quickly and stay together. Any team wanting to simplify their Product Introduction Panel can use these templates to help take their product from an idea to success on the market.
PS: The Top 7 Product Launch Plan Templates will give you the perfect templates to kick off the process.
FAQs on Product Launch Dashboard
1. What is a product dashboard?
A product dashboard uses charts and tables to measure a product’s progress, metrics and status during its development. It gathers task information, budget data, risks and timeline details into one platform.
2. What are the 7 steps to launch a new product?
Steps 1 to 7 are idea generation, market research, product development, testing, creating a marketing strategy, launching the product, and analyzing after launch. Every action helps the product fit the market's requests and achieve the business goals.
3. What is a product launch checklist?
A product launch checklist lists the important jobs you have to do before, during and after launching your product. It supports work teams in maintaining order and ensures everything significant is included.


