


Business Valuation Powerpoint Presentation Slides


Try Before you Buy Download Free Sample Product
 Impress Your
 Audience
Editable
of Time


Enlighten folks about a healthy diet with our Business Valuation Powerpoint Presentation Slides. Inform them of all the benefits that accrue.
People who downloaded this PowerPoint presentation also viewed the following :
Content of this Powerpoint Presentation
Slide 1: This slide showcase Business Valuation where you can enter your company name.
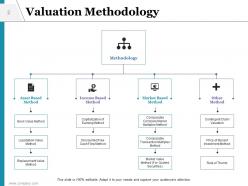
Slide 2: This slide represents Valuation Methodology based on various below listed factors using nice diagram: Asset Based Method, Income Based Method, Market Based Method, Other Method, Book Value Method, Capitalization of Earning Method, Comparable Company Market Multiples Method, Contingent Claim Valuation, Liquidation Value Method, Discounted Free Cash Flow Method, Comparable Transaction Multiples Method, Price of Recent Investment Method, Replacement Value Method, Market Value Method (For Quoted Securities), Rule of Thumb.
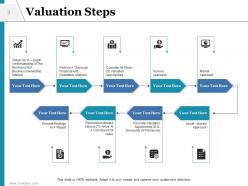
Slide 3: This slide represents about Valuation Steps using nice step diagram.
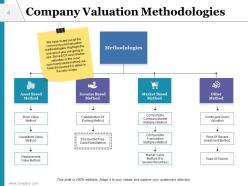
Slide 4: This slide is about Company Valuation Methodologies which covers important factors: Asset Based Method, Income Based Method, Market Based Method, Other Method, Book Value Method, Capitalization Of Earning Method, Comparable Company Market Multiples Method, Contingent Claim Valuation, Liquidation Value Method, Discounted Free Cash Flow Method, Comparable Transaction Multiples Method, Price Of Recent Investment Method, Replacement Value Method, Market Value Method (For Quoted Securities), Rule Of Thumb.
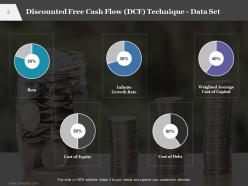
Slide 5: This slide shows Discounted Free Cash Flow (DCF) Technique - Data Set using nice background and icons.
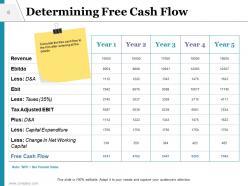
Slide 6: This slide helps in Determining Free Cash Flow once you enter the data.
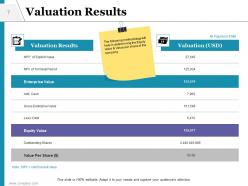
Slide 7: This slide shows Valuation Results highlighting main categories. The methodology used will help in determining the Equity value & Value per share of the company
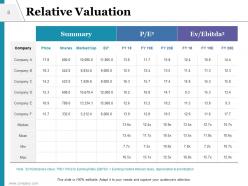
Slide 8: This slide showcase Relative Valuation in a tabular format.
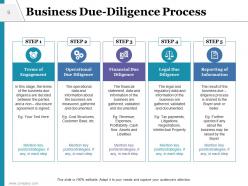
Slide 9: This slide represents Business Due-Diligence Process explained in 5 different stages. STEP 1 Terms of Engagement, In this stage, the terms of the business due diligence are decided between the parties and a non – disclosure agreement is signed. Mention key points/strategies, if any, in each step. STEP 2 Operational Due Diligence, The operational data and information about the business are measured, gathered and documented. Mention key points/strategies, if any, in each step Eg: Cost Structures, Customer Base, etc. STEP 3 Financial Due Diligence The financial statement, data and information of the business are gathered, validated and documented. Mention key points/strategies, if any, in each step Eg: Revenue, Expenses, Profitability, Cash flow, Assets and Libalities STEP 4 Legal Due Diligence The legal and regulatory data and information of the business are gathered, validated and documented. Mention key points/strategies, if any, in each step Eg: Tax payments, Litigations, Registrations, Intellectual Property STEP 5 Reporting of Information The result of the business due – diligence process is shared to the Buyer and/ or Seller. Mention key points/strategies, if any, in each step Eg: Further queries if any about the business may be raised by the Buyer
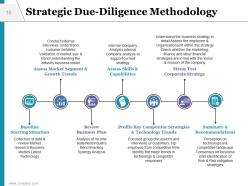
Slide 10: This slide represents Strategic Due-Diligence Methodology based on different criteria. Baseline, Starting Situation, Assess Market Segment & Growth Trends, Review Business Plan, Assess Skills & Capabilities, Profile Key Competitor Strategies & Technology Trends, Stress Test Corporate Strategy, Summary & Recommendations.
Slide 11: This slide displays Icon Slide which has extra set of icons.
Slide 12: This slide reminds about 10 Minutes Coffee Break. You may alter the slide as per need.
Slide 13: This slide displays Graphs And Charts. This indicates that further slides are about graphs and charts. You can change the title.
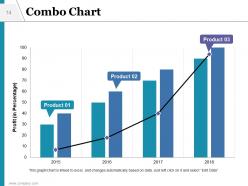
Slide 14: This slide represents Combo Chart and is designed with the combination of line and graph chart.
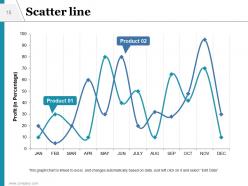
Slide 15: This slide represents Scatter Chart displayed with line graph.
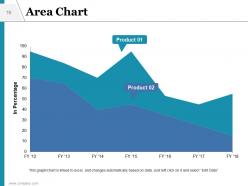
Slide 16: This slide represents Stack Area Chart. This graph/chart is linked to excel, and changes automatically based on data. Just left click on it and select “Edit Data”.
Slide 17: This slide says Additional Slides. You can change the title and slide content.
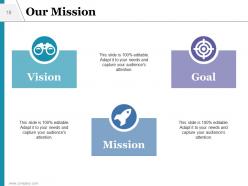
Slide 18: This slide represents Our Mission slide. You can write your company's mission, vision and goal.
Slide 19: This slide represents about our team. You can enter name, designation and images of the team members.
Slide 20: This slide represents About Us and you can enter your company important details.
Slide 21: This slide represents Our Goal. You can enter your company's goal and you can change image as well.
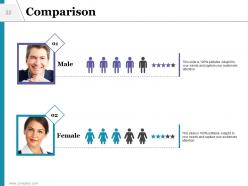
Slide 22: This is a Comparison slide represented by using nice icons and images.
Slide 23: This slide represents quotes. You can use any other quote as well.
Slide 24: This slide can be used to enter text using Venn diagram.
Slide 25: This last slide is Thank You slide. You can write your company address, contact number and email address.
Business Valuation Powerpoint Presentation Slides with all 25 slides:
Add to the edge you already have with our Business Valuation Powerpoint Presentation Slides. It will increase your advantage.


FAQs for Business Valuation
Okay so there are basically three ways to value a company. Asset-based is simple - what they own minus debts. Doesn't tell you much about growth potential though. Then there's income-based stuff like DCF that tries to predict future cash flows, but honestly those projections can be total guesswork sometimes. Market-based compares your company to similar ones that sold recently. Each method spits out different numbers, which is why most people use all three and try to find a reasonable middle ground. Just pick whatever makes sense for your industry and situation.
Market conditions are basically like a volume knob for what your business is worth. Good times? Valuations go crazy high. Bad times mean even decent companies take a hit on their value. Industry multiples shift around, investors get either greedy or scared, and comparable sales tell the whole story. During bull runs everyone's tossing money everywhere and overpaying for everything - honestly it's kind of wild to watch. Bear markets flip that script completely. Buyers turn into total cheapskates wanting discounts for any little risk they can find. Smart move is timing your valuation right, or if you're in a rough patch, just wait it out.
You absolutely need financial statements to value any company - there's no way around it. They show you historical performance so you can spot revenue trends, profitability patterns, and cash flow health. The income statement helps you project future earnings, balance sheet shows assets and liabilities, cash flow statement reveals actual cash generation. Honestly, audited statements are way better if you can get them - garbage data in, garbage valuation out. I learned that the hard way on a deal last year. These statements are basically your raw ingredients for whatever valuation method you're using.
Dude, intangible assets are honestly huge for valuations. Patents, trademarks, customer lists, your proprietary software - this stuff often makes up most of a company's real worth nowadays. Apple's brand value alone is insane when you think about it. The annoying thing? Regular accounting totally misses their actual value. You'll need income projections or market comps to figure out what they're really worth. Tech companies especially - their intangibles can dwarf everything else on paper. Don't ignore them when you're crunching numbers because that's where the money actually is.
Honestly, cash flow projections are like the foundation of any decent business valuation. They tell you what a company will actually spit out in cash over time - and that's what really matters to investors. DCF models use these to discount future flows back to today's value. Here's the thing though: your assumptions about growth, margins, and capital needs have to be realistic. Garbage in, garbage out, you know? I've seen way too many overly rosy projections that don't match reality. Build conservative assumptions you can actually defend rather than pie-in-the-sky numbers.
So here's the deal - industry trends basically make or break your valuation. Growing sectors like AI or renewable energy? You'll get crazy high multiples because everyone's betting on future growth. Meanwhile, traditional retail and print media are getting hammered even when their current numbers look decent. Buyers aren't just paying for what you are now, they're gambling on what you'll become. Honestly, it's kind of unfair but that's how the game works. Before any valuation meeting, dig into where your industry's headed and have a solid story about how you'll adapt. The narrative matters almost as much as the numbers.
Dude, biggest mistake is using crappy or old financial data - total garbage in, garbage out situation. Wrong valuation method for your industry will screw you over too. Don't just stick to one approach; try a few different methods to see if they line up. Market conditions change everything, so check recent sales in your area. Oh, and if it's your own business? You're probably way too emotionally invested to be objective about it. Honestly happened to my cousin last year - he thought his restaurant was worth twice what it actually was. Get someone else to look at your numbers, especially your future projections. Fresh perspective helps tons.
Honestly, there's a couple ways to tackle this. Add up your assets minus debts first - that's your baseline. Finding comparable business sales is a nightmare though, good luck with that one. If you've got steady cash flow, try the income method - take your annual earnings and multiply by whatever multiple your industry uses. I'd run at least two different approaches since they'll probably give you different numbers. And if this is for anything serious like selling or divorce stuff, just bite the bullet and hire a real appraiser. Trust me on that one.
Hey! Investors care about your team first - can you actually pull this off? Market size is big too, but honestly, growth potential matters more than pure size. They'll want to see your revenue model and whatever traction you've got so far. Defensibility against competitors is huge. Do you have any kind of moat or advantage? I always think the competitive landscape question trips people up the most. Your startup's stage obviously changes what they're looking for. Bottom line - nail these points in your pitch deck before you walk into those meetings.
Look, economic indicators basically control how much people think your business is worth. Good GDP growth, low unemployment, stable inflation? Investors get excited and pay more. But flip that - interest rates spike or consumer confidence tanks - and suddenly everyone's way more cautious about valuations. Track stuff like interest rates and industry metrics because timing matters big time when you're trying to sell or raise money. It's honestly like reading the room before making your pitch. Nobody wants to admit it, but market sentiment drives so much of this stuff.
So there's three ways to figure out what your business is worth. Asset-based just looks at what you own minus debt - pretty straightforward balance sheet stuff. Then there's income-based, which takes your future cash flows and brings them back to today's dollars (honestly my go-to for companies making decent money). Market-based compares you to similar businesses that sold recently. Here's the thing though - you really should use at least two methods. Asset approach might totally miss intangible stuff, and good luck finding truly comparable companies for the market method. I'd start with whatever fits your industry best.
Honestly, get your books cleaned up first - like actually clean, not just "looks fine to me" clean. Three years of solid financial statements are non-negotiable. I watched a buddy's sale almost fall through because his QuickBooks looked like a dumpster fire. Gather all your contracts, employee stuff, customer agreements too since they'll want to see everything. Oh, and try to make the business run without you constantly hovering - that's huge for valuation. Start this whole mess at least 6 months early. Trust me, last-minute scrambling just makes you look unprepared and desperate.
Dude, M&A stuff can really bump up what your company's worth. Strategic buyers usually pay way more than financial ones - like 20-40% more - because they can actually use those synergies (cost cuts, bigger market reach, whatever). Industry consolidation creates this weird bidding war effect where everyone's competing. Honestly, even rumors about deals can move your valuation up. Wild how that works. If you're thinking about selling, try timing it when there's buzz about acquisitions in your space. Those strategic premiums are no joke - they'll pay extra for synergies that financial buyers can't really capture.
Oh yeah, this stuff matters way more than people think. C-corps usually get better valuations since investors get them easily - no weird tax pass-through headaches. LLCs? Some investors literally won't touch them because of the K-1 nightmare (my accountant still complains about mine from 2019 lol). Your structure also changes how easy it is to transfer ownership and run things day-to-day. Buyers definitely notice. If you're thinking exit or fundraising, change it now - I've seen deals get messy when you're trying to restructure mid-negotiation. Way harder than doing it upfront.
BizComps, Pratt's Stats, and DealStats are probably your best bet for transaction multiples - just know they're expensive unless you already have access. For public comps, S&P Capital IQ is solid, or honestly even Yahoo Finance works fine for basic stuff. Trade associations publish some really good industry studies too that people overlook. I'd check what your firm already pays for first since those subscriptions add up fast. If you're gonna be doing valuations regularly though, BizComps is probably worth it. Start there and see what gaps you still have.
-
Colors used are bright and distinctive.
-
Informative presentations that are easily editable.