


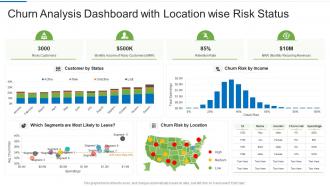
Churn analysis dashboard with location wise risk status





Try Before you Buy Download Free Sample Product
 Impress Your
 Audience
 100%
100% Editable
 Save Hours
 of Time


Our Churn Analysis Dashboard With Location Wise Risk Status are topically designed to provide an attractive backdrop to any subject. Use them to look like a presentation pro.
People who downloaded this PowerPoint presentation also viewed the following :
Churn analysis dashboard with location wise risk status with all 10 slides:
Use our Churn Analysis Dashboard With Location Wise Risk Status to effectively help you save your valuable time. They are readymade to fit into any presentation structure.








FAQs for Churn analysis dashboard with location
Key metrics for a churn analysis dashboard include churn rate, customer lifetime value, retention rate, monthly recurring revenue impact, and predictive risk scores. These metrics enable organizations to identify at-risk segments, track financial implications, and implement proactive retention strategies, with many businesses finding that comprehensive dashboards reduce churn by 15-25% through data-driven interventions.
Visualizations enhance churn understanding by transforming complex data patterns into clear, actionable insights through trend lines, heat maps, cohort analyses, and predictive modeling charts. These visual tools enable businesses to quickly identify at-risk customer segments, seasonal patterns, and retention opportunities, with companies like subscription services and telecom providers finding that visual dashboards accelerate decision-making and improve targeted retention strategies.
Essential data sources for churn analysis include customer transaction records, engagement metrics, support interactions, demographic information, and subscription details. These datasets enable organizations to identify behavioral patterns, predict at-risk customers, and develop targeted retention strategies, with many businesses finding that combining multiple data streams significantly enhances prediction accuracy and reduces customer acquisition costs.
Segmentation improves churn prediction accuracy by identifying distinct customer behavior patterns, risk factors, and engagement levels across different groups, enabling more targeted predictive models. Through demographic, behavioral, and value-based segmentation, organizations can develop specialized retention strategies for high-value clients, frequent users, and at-risk segments, ultimately delivering more precise predictions and effective interventions.
Customer feedback provides crucial qualitative insights that complement quantitative churn metrics, revealing specific pain points, service gaps, and satisfaction drivers that standard analytics might miss. Through sentiment analysis, survey data, and support interactions, businesses can identify at-risk segments earlier, address underlying issues proactively, and ultimately reduce churn rates while enhancing customer retention strategies.
**INPUT**: How frequently should a churn analysis dashboard be updated? **OUTPUT**: Churn analysis dashboards should typically be updated daily or weekly, depending on customer transaction frequency, business model, and churn risk patterns within your industry. Real-time updates work best for subscription services, telecommunications, and financial services, while monthly updates suffice for longer sales cycle businesses, with many organizations finding that frequent monitoring enables proactive retention strategies and significantly reduces customer acquisition costs. [Word count: 60]
Common customer churn reasons include poor service quality, competitive pricing pressures, inadequate product features, lack of personalized experiences, and insufficient customer support responsiveness. These factors vary significantly across sectors, with retail facing price sensitivity challenges, financial services dealing with digital experience gaps, and SaaS companies struggling with feature limitations, ultimately requiring industry-specific retention strategies for competitive advantage.
Predictive analytics can be integrated through machine learning algorithms, real-time data processing, automated risk scoring, predictive modeling features, and customer lifetime value calculations. These technologies enable businesses to identify at-risk customers early, automate retention campaigns, and prioritize high-value accounts, with many organizations finding that proactive interventions reduce churn rates by 15-25%.
Effective churn reduction strategies include targeted retention campaigns for at-risk segments, personalized offers based on usage patterns, proactive customer success interventions, and loyalty program enhancements for high-value accounts. These dashboard-driven approaches enable companies to reduce churn rates by 15-25%, with telecommunications and subscription services finding that predictive interventions significantly improve customer lifetime value and competitive positioning.
A churn analysis dashboard informs marketing and sales strategies by identifying at-risk customer segments, revealing behavioral patterns that predict departures, and highlighting retention opportunities through real-time data visualization. These insights enable targeted retention campaigns, personalized outreach timing, and strategic resource allocation, with many organizations finding that data-driven approaches significantly reduce acquisition costs while enhancing customer lifetime value.
Popular tools for creating churn analysis dashboards include Tableau, Power BI, Looker, Qlik Sense, and specialized platforms like ChurnZero or Gainsight. These solutions streamline data visualization, predictive modeling, and real-time monitoring, with many organizations finding that combining business intelligence tools with customer success platforms delivers comprehensive insights, automated alerts, and actionable retention strategies that ultimately reduce churn rates.
Success measurement involves tracking key metrics like churn rate trends, customer retention percentages, revenue recovery, and initiative ROI through real-time dashboard visualizations. These dashboards enable organizations to monitor campaign effectiveness, compare pre-and-post initiative performance, and identify successful strategies, with many businesses finding that visual analytics streamline decision-making and accelerate optimization efforts.
Maintaining data accuracy for churn analysis faces challenges including incomplete customer records, inconsistent data formats across systems, delayed data updates, and integration issues between multiple platforms. These obstacles can significantly impact predictive model reliability, with many organizations finding that streamlined data governance, automated validation processes, and real-time synchronization ultimately enhance analytical precision and customer retention strategies.
A/B testing validates churn reduction strategies by comparing control groups against those receiving targeted interventions, measuring retention rates, engagement metrics, and customer lifetime value across different approaches. Through systematic testing of personalized offers, communication frequency, and retention campaigns, companies can identify which strategies deliver measurable improvements, ultimately enabling data-driven decisions that significantly reduce churn rates.
Poor onboarding quality significantly increases churn rates, with inadequate training, unclear expectations, and insufficient early support driving customer abandonment during critical first months. Organizations implementing structured onboarding programs, personalized guidance, and proactive check-ins typically see 60-70% lower churn rates, ultimately delivering stronger retention, higher lifetime value, and improved customer satisfaction across diverse industries.
-
Great product with highly impressive and engaging designs.
-
Great product with effective design. Helped a lot in our corporate presentations. Easy to edit and stunning visuals.
-
Top Quality presentations that are easily editable.