

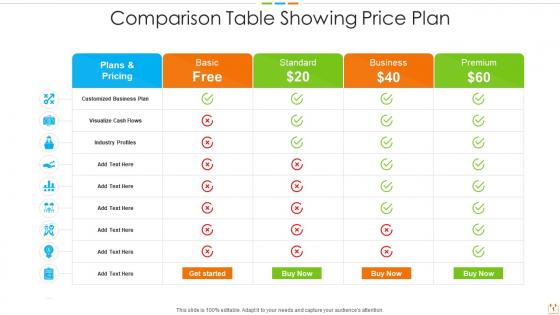
Comparison table showing price plan




Try Before you Buy Download Free Sample Product
 Impress Your
 Audience
 100%
100% Editable
 Save Hours
 of Time


Our Comparison Table Showing Price Plan are topically designed to provide an attractive backdrop to any subject. Use them to look like a presentation pro.
People who downloaded this PowerPoint presentation also viewed the following :
Comparison table showing price plan with all 9 slides:
Use our Comparison Table Showing Price Plan to effectively help you save your valuable time. They are readymade to fit into any presentation structure.









FAQs for Comparison table
Key features include pricing tiers, template quantities per tier, customization options, licensing terms, and support levels. These elements streamline decision-making by highlighting value propositions, usage rights, and service differences, with many organizations finding that clear comparison tables accelerate procurement processes and enhance stakeholder buy-in.
A price comparison table helps potential customers make informed decisions by presenting features, pricing tiers, and value propositions side-by-side, enabling quick evaluation of options across multiple criteria. This streamlined approach reduces decision fatigue, builds trust through transparency, and accelerates purchase decisions, with many businesses finding that clear comparisons ultimately enhance customer confidence and conversion rates.
Visual elements that enhance price comparison tables include clear column headers, contrasting colors for different tiers, bold highlighting for recommended options, consistent spacing, and strategic use of icons or checkmarks. These design choices streamline decision-making by improving readability, emphasizing key differences, and guiding customer attention, with many e-commerce and SaaS companies finding that well-designed tables significantly increase conversion rates and reduce purchase hesitation.
Determining relevant criteria involves evaluating template flexibility, design quality, content structure, customization options, and industry applicability based on your specific presentation goals. Successful comparisons typically focus on slide variety, visual consistency, ease of editing, and compatibility with branding requirements, with many organizations finding that templates offering comprehensive layouts, professional aesthetics, and seamless integration ultimately deliver stronger audience engagement.
Customer feedback drives price comparison table development by identifying desired filters, sorting preferences, display formats, and usability improvements that enhance decision-making processes. Through user insights, businesses refine features like advanced search capabilities, mobile optimization, and personalized recommendations, with many e-commerce platforms finding that feedback-driven enhancements significantly improve conversion rates and customer satisfaction.
A price comparison table improves user experience by presenting pricing information clearly, reducing decision-making time, and enabling quick feature comparisons across different template packages. This streamlined approach eliminates confusion and frustration, with many template websites finding that well-designed comparison tables significantly increase conversion rates while reducing support inquiries about pricing details.
Common mistakes include overcrowding with excessive features, using inconsistent formatting across columns, highlighting too many options simultaneously, and failing to align features with target audience needs. Many businesses find that cluttered tables, unclear pricing tiers, missing key differentiators, and poor visual hierarchy ultimately confuse prospects rather than streamline decision-making, reducing conversion rates significantly.
Price comparison tables should be updated weekly or bi-weekly for fast-moving consumer goods, monthly for standard retail products, and quarterly for B2B services or enterprise software. The frequency depends on market volatility, competitor pricing strategies, and product lifecycle stages, with many retail organizations finding that automated monitoring systems enable real-time updates, ultimately delivering competitive advantage and accurate customer experiences.
Tools for creating dynamic price comparison tables include TablePress, WP Product Review, Ninja Tables, DataTables, and custom JavaScript solutions like Chart.js or D3.js. These platforms streamline pricing displays by enabling real-time updates, responsive design, and automated data integration, with many e-commerce businesses finding that dynamic tables enhance customer decision-making and ultimately boost conversion rates.
User ratings and testimonials can be incorporated through dedicated columns displaying star ratings, review scores, and brief customer quotes alongside pricing data. This strategic combination enables consumers to evaluate both cost and quality simultaneously, with many retail and service platforms finding that integrated feedback systems enhance user trust, reduce decision-making time, and ultimately deliver higher conversion rates.
Highlighting discounts and promotions in price comparison tables enhances customer decision-making by increasing transparency, creating urgency, building trust through clear value propositions, and driving conversion rates. These visual indicators enable retailers to showcase competitive advantages while helping consumers quickly identify savings opportunities, ultimately delivering improved customer experiences and higher sales performance across e-commerce platforms.
SEO practices enhance price comparison tables by incorporating targeted keywords, optimizing meta descriptions, and structuring data with schema markup for better search visibility. Through strategic keyword placement, clear headings, and fast-loading responsive design, retailers can improve search rankings while delivering comprehensive product comparisons, ultimately attracting more qualified traffic and increasing conversion rates.
HTML tables work best for website price comparison displays, offering responsive design, search engine optimization, interactive filtering, and seamless mobile compatibility, while Excel formats serve well for downloadable resources and detailed offline analysis. Many e-commerce and SaaS companies combine both approaches, using HTML for primary web presentation and Excel exports for comprehensive data sharing, ultimately delivering enhanced user experiences and improved conversion rates.
Mobile responsiveness and design significantly affect price comparison table usability by ensuring readability across devices, optimizing touch interactions, and maintaining clear visual hierarchy. Through responsive layouts, retailers and service providers streamline customer decision-making, reduce bounce rates, and enhance user experience, with many e-commerce platforms finding that mobile-optimized comparison tables ultimately deliver higher conversion rates and improved customer satisfaction.
**INPUT**: What strategies can be employed to drive traffic to a page featuring a price comparison table? **OUTPUT**: Effective strategies include search engine optimization with price-focused keywords, social media campaigns highlighting value propositions, email marketing to existing customers, and strategic partnerships with deal-sharing platforms. These approaches streamline customer discovery by targeting comparison shoppers, enhancing visibility through multiple channels, and leveraging user intent, ultimately delivering higher conversion rates and competitive advantage.
-
Easily Editable.
-
Graphics are very appealing to eyes.
-
Designs have enough space to add content.
-
Topic best represented with attractive design.
-
Colors used are bright and distinctive.