


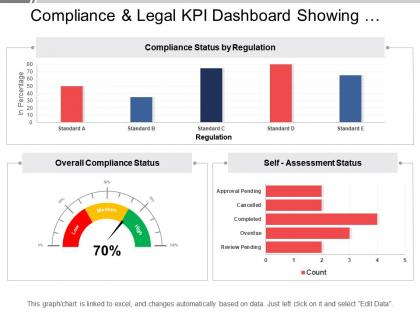
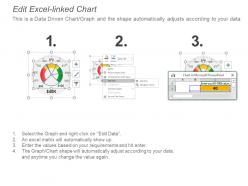
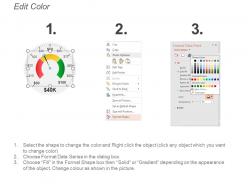
Compliance and legal kpi dashboard showing overall compliance status





Try Before you Buy Download Free Sample Product
 Impress Your
 Audience
 100%
100% Editable
 Save Hours
 of Time


Influence future developments with our Compliance And Legal Kpi Dashboard Showing Overall Compliance Status. Determine how events will evolve.
People who downloaded this PowerPoint presentation also viewed the following :
Compliance and legal kpi dashboard showing overall compliance status with all 6 slides:
Your ideas ensure a jampacked hall due to our Compliance And Legal Kpi Dashboard Showing Overall Compliance Status. It will get the jar brimming over.
FAQs for Compliance and legal kpi dashboard showing
Track your compliance percentages and how many violations are still hanging out there - that's your bread and butter. Time-to-resolution is huge too. I'd put risk levels and audit findings right up top since those are the things that'll bite you. Oh, and definitely monitor training completion rates because that's usually where everything falls apart first. Set up alerts for the critical stuff so you're not babysitting the dashboard all day. Also throw in some trend analysis and regulatory deadlines with status updates. Honestly, patterns are everything - catch them early before they blow up.
So first figure out which regulations actually apply to you - SOX if you're public, GDPR for data stuff, whatever. Then map those to your actual data sources and set up widgets that track what regulators care about. Honestly, the goal is spotting problems before auditors show up at your door. Automated reports are clutch for hitting compliance deadlines. Most platforms have templates so you're not building everything from scratch. Oh, and definitely set up different views for different teams - finance doesn't need to see what IT's tracking. Makes everyone's life easier.
Think of it like driving with GPS vs. an old paper map. Real-time data lets you catch compliance issues the moment they pop up, not weeks later when you're doing quarterly reviews. You can actually fix problems before they turn into expensive fines or regulatory headaches. Honestly, making decisions without current data is like flying blind - and nobody wants that stress. Oh, and definitely set up alerts for your critical metrics so you get pinged right away when something breaks. Way better than finding out the hard way.
Honestly, charts and dashboards are lifesavers when you're trying to get people to actually care about compliance stuff. Nobody wants to stare at endless spreadsheets - trust me on that one. Visual data just clicks better. You can spot trends and weird outliers right away, plus executives eat up those red/yellow/green status indicators. The trick is knowing your audience though. Board members want the big picture summary, while your tech people will probably want to dig into all the messy details. Figure out what decisions each group needs to make first, then build visuals that actually help them get there.
Don't try to cram everything onto one screen - honestly, it just creates this mess that nobody wants to deal with. Most companies get obsessed with flashy metrics that look impressive but regulators couldn't care less about them. Big mistake is leaving compliance out until the end, then you're stuck rebuilding the whole thing to match how they actually work. Oh, and those vanity metrics? Total waste of time if auditors never ask about them. Start with maybe 3-5 things your auditors bug you about most. You can always add more later once people actually start using it.
Dude, these tools are game changers. No more pulling data from like five different systems and praying everything matches up. They grab everything in real-time and spot issues right away - way better than finding out three weeks later your numbers were trash. Reports get generated automatically too, so you're not rebuilding the wheel every month. Honestly, the manual way is such a time suck. Now you can actually look at what the data means instead of just collecting it. My reports went from taking days to maybe an hour tops.
Real-time alerts are clutch - set them to ping you when anything goes sideways with your risk thresholds. Heat maps make everything visual, which honestly saves your butt during board meetings since nobody wants to stare at spreadsheets. You need automated tracking for all the regulatory stuff, plus exception reports that catch weird outliers right away. Audit trails and trend analysis help you see problems coming instead of scrambling after. Oh, and centralize everything with drill-down options - trust me on this one. Start with whatever's giving you the biggest headaches first.
Look, user access is make-or-break for compliance dashboards. Give everyone access? You're asking for data breaches and regulatory headaches. Too restrictive and your team can't actually do their work - missed deadlines, overlooked issues, the whole mess. Role-based permissions are your friend here. People only see what they need for their specific job. Always set up audit trails too - you want to know who looked at what and when. Honestly, I've seen too many companies try to bolt on permissions later and it's a nightmare. Do it right from the start.
Oh yeah, compliance dashboards are perfect for this! You'll see exactly who finished what training and spot gaps instantly. Set up those automated reminders first - trust me, people always forget about renewals. The visual stuff is really helpful too, like when you notice your sales team keeps skipping the data privacy modules (happens literally everywhere). Different departments have weird patterns you wouldn't expect. You can pull reports for auditors showing all your training efforts, plus track completion rates and see which topics people actually struggle with. Honestly just start with the renewal alerts and build from there.
Daily updates work for most compliance dashboards - keeps things current without going crazy with alerts. High-risk stuff like financial services? Yeah, you'll probably want hourly or even real-time monitoring. But honestly, it comes down to how fast your compliance status actually changes. If you're tracking annual safety training, daily is overkill. I'd say start with daily refreshes and see how it goes. You can always dial it up if you notice issues slipping through the cracks. The worst thing is alert fatigue where people just start ignoring notifications.
Keep it clean and simple - clarity beats fancy design every time. Green for good, red for problems, yellow for warnings, but seriously don't make it look like a crayon box threw up. Put your biggest compliance headaches right at the top where people can see them immediately. Group similar stuff together and leave plenty of white space. Honestly, cramped dashboards just make everyone more stressed when they're already freaking out about compliance. Oh, and test it with real users who actually have to use this thing daily - they'll spot the annoying stuff you totally missed.
Honestly, the biggest ROI usually comes from time savings - track how many hours your team wastes on manual reporting vs. what an automated dashboard could do. Also factor in avoided penalties since better oversight catches issues faster. Most places I've seen hit payback around 6-12 months, sometimes sooner if they were really drowning in spreadsheets before. Audit prep gets way smoother too, plus stakeholders actually trust your data. Those softer benefits are real but yeah, harder to put a dollar amount on. Start documenting your current manual mess now so you'll have solid numbers to show the difference later.
So compliance dashboards are getting crazy smart with AI and machine learning - we're talking real-time risk detection and predictive stuff that actually works. Cloud solutions are everywhere now because honestly, who wants to mess with on-premise anymore? The data visualization has gotten so much better too. You can finally show executives messy compliance data in a way they'll get instantly. Integration's way smoother between different systems now, which is huge. Oh and when you're shopping around, definitely focus on AI features and how well it plays with your existing setup - that's where the real value is.
Yeah, most compliance dashboards can hook up to BI tools pretty easily now. APIs work great, or you can use data connectors if your platform has them. Power BI and Tableau are usually your best bet - honestly way less painful than it used to be a few years back. What's cool is you can layer your compliance stuff right over your regular business data. Makes it super obvious when something's trending toward a problem. Check what BI tool you're already using first, then see what your compliance dashboard connects to. You'll probably find they play together better than expected.
Oh nice question! JPMorgan built this risk monitoring dashboard that slashed their regulatory reporting by 60% - honestly pretty crazy numbers. Goldman Sachs has one tracking trading compliance that's apparently saved them from tons of violations. Johnson & Johnson uses theirs for pharma stuff, monitoring manufacturing quality across all their facilities in real time. The key thing they all did was focus on automation and live alerts instead of boring static reports. You should definitely dig into their case studies for the actual ROI numbers - it'll make your business case way stronger.
-
Amazing product with appealing content and design.
-
Colors used are bright and distinctive.