


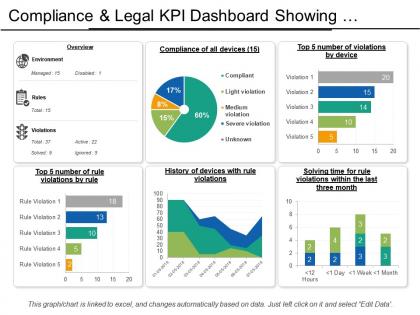
Compliance and legal kpi dashboard showing violations by devices


Try Before you Buy Download Free Sample Product
 Impress Your
 Audience
Editable
of Time


Our Compliance And Legal Kpi Dashboard Showing Violations By Devices generate feelings of harmony. They get folks to blend with each other.
People who downloaded this PowerPoint presentation also viewed the following :
Compliance and legal kpi dashboard showing violations by devices with all 6 slides:
Directions given become crystal clear to all due to our Compliance And Legal Kpi Dashboard Showing Violations By Devices. It is an ideal instructional device.


FAQs for Compliance and legal kpi dashboard showing
Look at violation rates and audit findings first - that's your baseline reality check. Track how fast you're fixing problems too, because dragging your feet there is where companies really get burned. Training completion rates matter more than people think (seriously, half of compliance issues trace back to someone who skipped training). Policy acknowledgments and regulatory deadlines round out the list. Stick to maybe 5-7 metrics total or you'll drown everyone in data. Just make sure you can dig deeper into each one when your boss inevitably asks follow-up questions.
Dude, compliance dashboards are honestly a game changer. Instead of waiting forever for reports, you get real-time data on your risk exposure and regulatory stuff. I always tell people to think of it like a health monitor for compliance - you catch problems before they blow up into actual violations. Set up automated alerts for the scary thresholds so you're not glued to your screen all day. Oh, and don't try to dashboard everything at once - that's overwhelming. Pick your riskiest areas first and build from there. You'll see exactly where to throw your resources and track fixes as they happen.
Traffic light colors are your best friend here - red/yellow/green makes status instantly clear. Put your most critical metrics right at the top where people can't miss them. I swear, half the dashboards I've seen look like someone just dumped a massive spreadsheet everywhere! Progress bars work great for percentages, and trend lines help show compliance patterns over time. Real-time data updates are huge - nobody wants to make decisions based on old info. Oh, and don't try to cram everything onto one screen. Start with your biggest compliance headaches first.
Honestly, automation is a game-changer for getting rid of all that tedious monthly data pulling. Your dashboards just grab everything directly from your systems in real-time - no more of those late-night Excel copy-paste sessions we all hate. You'll spot problems way faster since everything updates automatically. Plus your reports won't have those random typos or formatting inconsistencies anymore. I'd say start with whatever data sources you're constantly logging into. Those are probably your biggest time-wasters and perfect candidates for automation. Trust me, once you set it up, you'll wonder why you waited so long.
Honestly, user feedback is everything for dashboard optimization. Your compliance team knows what's actually broken - like when those KPI widgets are impossible to find or alerts won't stop going off. Monthly check-ins are perfect for this stuff. They'll tell you which metrics are missing too. Look, you can build something that looks amazing, but if people can't spot violations fast or pull reports easily, you've basically wasted your time. Their suggestions will show you pain points you'd never notice on your own. Just make sure you actually use what they tell you.
Honestly, just figure out what regulations you actually need to track first - like SOX if you're in finance or HIPAA for healthcare stuff. Most platforms let you add custom fields and set up automated alerts for deadlines. I'd focus on your top 3-5 requirements instead of using whatever generic setup they give you. Build your dashboard around those specific needs. Way easier than trying to wade through a bunch of irrelevant metrics later. Oh, and definitely create industry-specific report templates - saves so much time when you're scrambling to pull compliance reports together.
Honestly depends what you're working with data-wise. Power BI and Tableau are great if you don't mind the learning curve - they play nice with most compliance stuff. Google Data Studio's way easier to start with though. Excel dashboards work fine too if your data isn't crazy complex. I've actually seen people do cool things with Airtable (weird flex but whatever). Really comes down to what your team will actually keep updated. My advice? Start basic with whatever tool you already know, then upgrade once you figure out which metrics actually matter. No point getting fancy software that sits unused.
So these dashboards basically give you a live view of all your compliance stuff - risk scores, gaps, trends, the whole deal. Think of it like a radar for potential problems. You can catch issues early before they blow up into actual headaches. The best part? You can sort out what needs fixing RIGHT NOW versus what you can just keep an eye on. Set up different views for each risk type though, trust me on this one - otherwise you'll be staring at a wall of data when you're trying to make fast calls. Oh, and the automated alerts are clutch when things hit your danger zones.
Honestly, the worst part is dealing with data silos - compliance stuff gets trapped in systems that refuse to play nice together. Your records will be messy and incomplete too, which makes building trustworthy dashboards basically impossible. Manual processes don't help either since they update at glacial speed. Oh, and good luck balancing what compliance teams need to see versus keeping executives happy with simple overviews. My advice? Map out where everything lives first. Seriously, I can't stress this enough - it'll save you from wanting to throw your laptop out the window later.
Honestly, start with automated validation rules at the source - that's your foundation right there. Compliance teams are like hawks, they'll spot inconsistencies before you even know they exist. Document your data lineage so people actually understand where numbers come from. Monthly audits are non-negotiable - compare your dashboard against the raw records religiously. Oh, and assign specific owners to different data streams. When things break (and they will), you need someone who's accountable. Set up alerts for weird patterns or missing data too. I learned this the hard way after spending a weekend fixing reports that could've been caught earlier.
Operational dashboards are your daily grind stuff - alerts going off, task lists, whatever's broken right now. Strategic ones show the bigger trends and patterns over months or years. Think of operational as your "oh crap what needs fixing" screen that you'll probably check every morning with your coffee. Strategic is more like your monthly reports for the boss meetings. Honestly, I'd start with operational first. You can't really analyze trends if you don't have your day-to-day chaos under control yet. Get those daily workflows down, then worry about the fancy trend analysis later.
Honestly, compliance dashboards are a game changer - they show you where you stand in real-time instead of finding out you're screwed during an audit. When regulators come knocking, you can pull up historical data instantly and show them your controls without digging through a million spreadsheets (been there, it sucks). The automation piece is huge too. No more spending entire weekends manually putting together quarterly reports. Just make sure you set yours up to actually match what your specific regulators want to see first, or you'll end up rebuilding the whole thing later.
Healthcare dashboards are perfect for this - they track HIPAA compliance, breach data, audit scores. Financial companies do the same thing with SOX requirements and risk assessments. Manufacturing gets into safety violations and environmental stuff. Honestly, pharma companies probably have the most impressive setups I've seen because FDA requirements are so intense. They're all doing real-time alerts instead of boring static reports, which makes way more sense. My advice? Start with whatever regulations actually apply to your industry first. Then build around the metrics your auditors care about most. Don't overcomplicate it.
Honestly, your compliance dashboard is perfect for this. Look at where people are actually struggling - specific departments, certain topics, whatever - then build training around those real gaps. Way better than those boring company-wide sessions nobody pays attention to anyway. Track completion rates to see if your programs actually work, and set up alerts when scores start dropping. That way you can do quick refreshers before things get messy. It's pretty smart - you're using actual data instead of just guessing what people need help with.
Honestly, predictive analytics is where everything's headed - these new tools actually catch problems before they blow up instead of just telling you what already happened. Real-time monitoring is pretty much expected now, plus automated risk scoring. The interfaces are finally getting better too (some were seriously painful to use). Mobile dashboards are a must since compliance people aren't chained to their desks anymore. Customizable views are big right now. I'd probably start shopping around for vendors with these features because what you're using now might feel ancient in like six months.
-
The Designed Graphic are very professional and classic.
-
Easy to edit slides with easy to understand instructions.