Do you ever hesitate to use oven mitts when handling hot dishes? Or do you fail to look both ways when crossing the street? Do you overlook checking the expiry date before purchasing food items? Most likely not. Just as these practices keep you safe in everyday life, health and safety measures in the workplace do the same. Why hesitate to prioritize them?
A Health and Safety Key Performance Indicators (KPIs) dashboard is an organizational tool that helps businesses measure and monitor essential metrics linked to workplace health and safety performance. KPIs serve as signposts, indicating possible threats and opportunities for development. Metrics such as incident rates, lost time injury frequency, and near-miss reporting provide information on the present state of workplace safety. They highlight where threats exist and where solutions are most urgently required.
It enables proactive decision-making through real-time data updates and trend analysis. Integration with incident reporting systems, staff training platforms, and compliance tools keeps the dashboard dynamic and adaptable to changing safety requirements.
Are you concerned about supervising or tracking your business activities? Our blog on the Top 10 HR KPI Dashboard Templates will help you organize your HR department's data and make it presentable.
Health and Safety KPIs
- Incident Rate: This KPI calculates the number of workplace incidents, accidents, injuries, or illnesses during a specific period, often per 100 employees or per million hours worked.
- The Lost Time Injury Frequency Rate (LTIFR): This determines the frequency of lost time injuries per million hours worked. Lost time injuries are occurrences that cause employees to be unable to work for an extended time.
- Safety Training Completion Rate: Determines the proportion of employees who have completed obligatory safety training programs. It ensures that staff have the appropriate knowledge and abilities to manage risks.
- Safety Inspection Findings: Records the outcomes of workplace safety inspections, including any identified dangers or noncompliance concerns.
- Safety Equipment Usage: Monitors the use and maintenance of personal protective equipment (PPE) and other safety equipment to guarantee its efficacy in safeguarding personnel.
- Employee absence: Tracking leaves due to sickness or injury can give information about the general health and safety of the workforce.
- Worker Satisfaction and Feedback: Surveys or feedback mechanisms collect employee feedback on safety regulations, procedures, and the general workplace environment.
SlideTeam’s PowerPoint Templates on Health and Safety KPIs showcase dashboards with these performance indicators and more. These PPT Slides are content-ready, completely editable, and customizable. They provide an extensive analysis of an organization's health and safety performance, allowing for proactive steps to avoid mishaps, safeguard employees, and foster a safety culture.
Let’s explore!
Template 1: Health And Safety Dashboard
This dashboard template provides transparency, allowing for informed decision-making and resource allocation. Organizations can minimize mishaps and build a safe culture by identifying leading indications and possible dangers. This PowerPoint Bundle in 17 slides showcases a dashboard for COVID-19 health and safety with test results, injury classification, severe injuries incident report, organization showing incident members, and more. Furthermore, tracking important performance indicators guarantees progress toward safety objectives and regulatory standards. Finally, health and safety dashboards are critical tools to ensure employee well-being and organizational performance.
Template 2: Health and Safety KPI Metrics Dashboard
This PowerPoint slide provides an overview of the KPIs essential to examining healthcare facility operations. It compares outpatient and inpatient trends, assesses overall patient satisfaction, and classifies patients by division. This dashboard helps you discover opportunities for improvement in healthcare delivery, ensures patient safety, and improves overall service quality. By concentrating on these KPIs, healthcare managers may make data-driven choices to optimize resource allocation and improve the patient experience, resulting in better health outcomes and organizational success. This template includes multiple charts and diagrams showcasing information in an easy-to-understand manner.
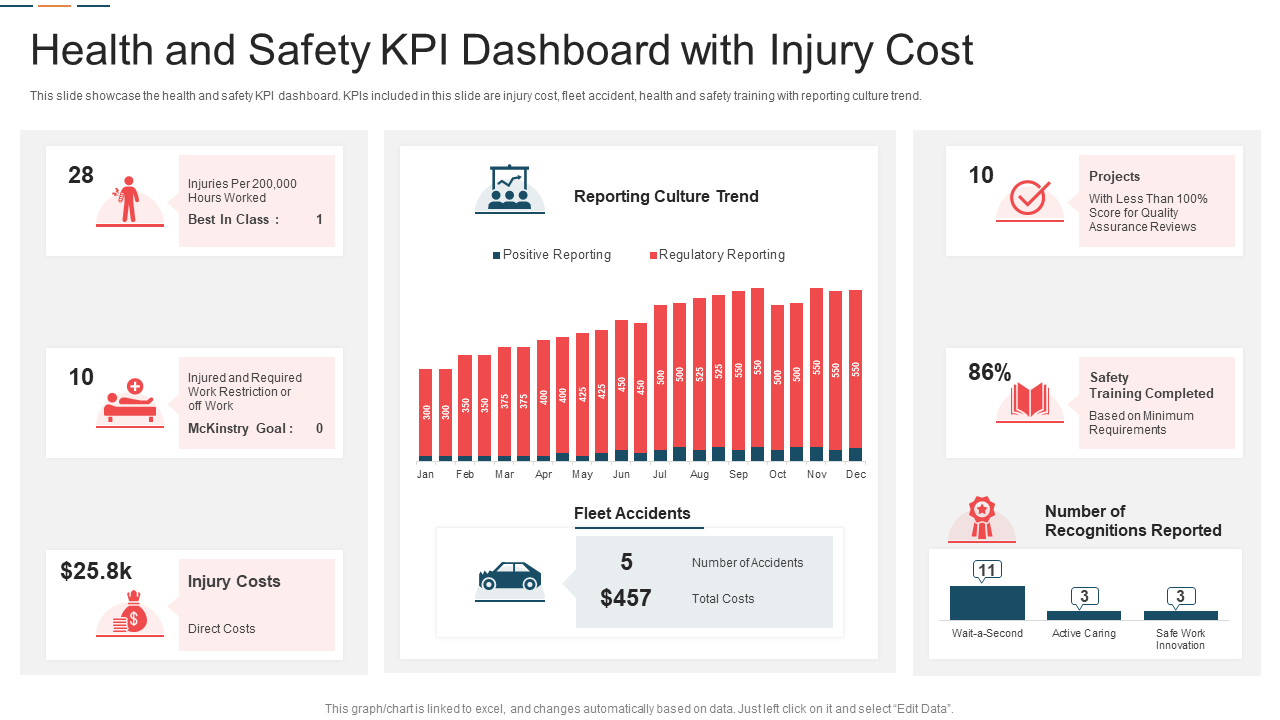
Template 3: Health and Safety KPI Dashboard with Injury Cost
This PowerPoint Slide showcases the health and safety KPI dashboard. It includes injury cost as a significant statistic, which helps all stakeholders, from executives to employees on the front lines. Executives obtain insight into the financial effect of injuries, which helps with budget allocation and risk management. Safety supervisors may monitor trends in fleet incidents and training effectiveness, enabling targeted interventions and better safety practices. Frontline workers benefit from a safer working environment created by an improved reporting culture. Finally, this dashboard encourages a safety culture, lowers injuries, and maximizes resources for the benefit of all employees.
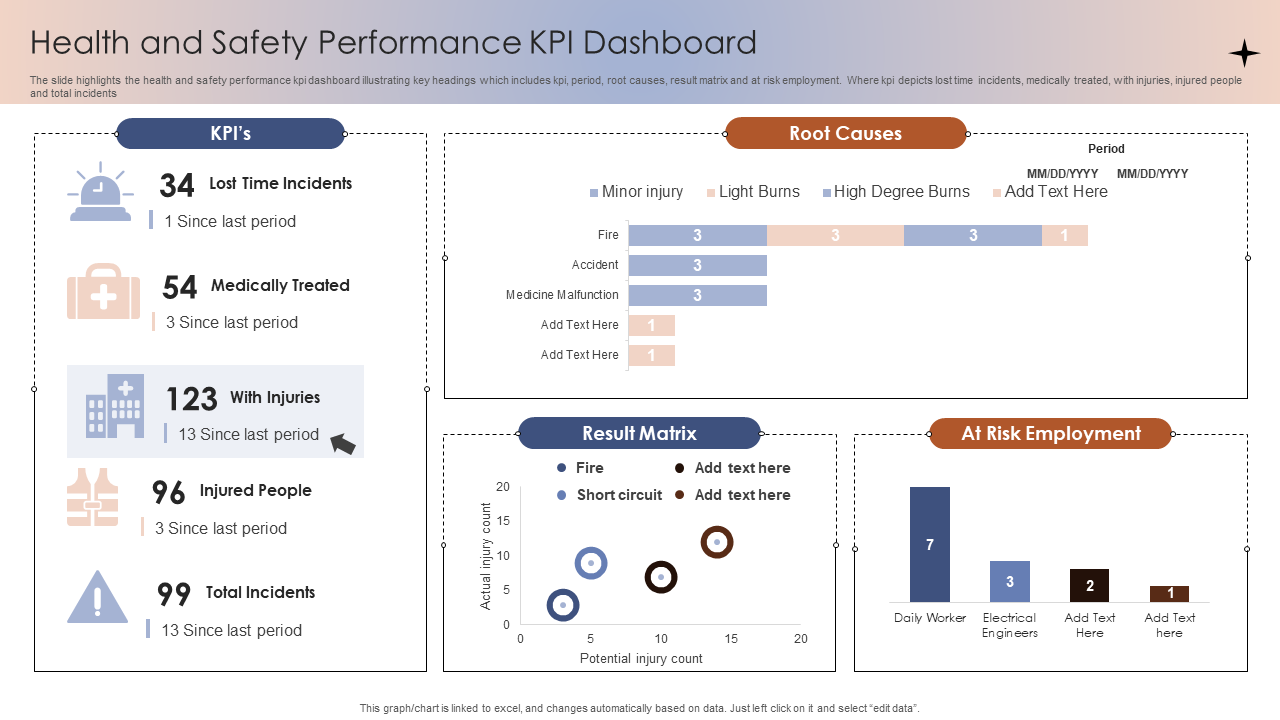
Template 4: Health And Safety Performance KPI Dashboard
This dashboard monitors essential performance indicators such as lost time incidents, medically treated incidents, injuries, injured personnel, and total incidents. It provides essential data under categories such as Period, Root Causes, Result Matrix, and At-Risk Employment. KPIs evaluate safety performance, whereas Period specifies the term for assessment. Root Causes identify fundamental difficulties, and At-Risk Employment identifies at-risk locations. This complete dashboard provides a simple overview of health and safety parameters, promoting responsible risk management and a safer workplace.
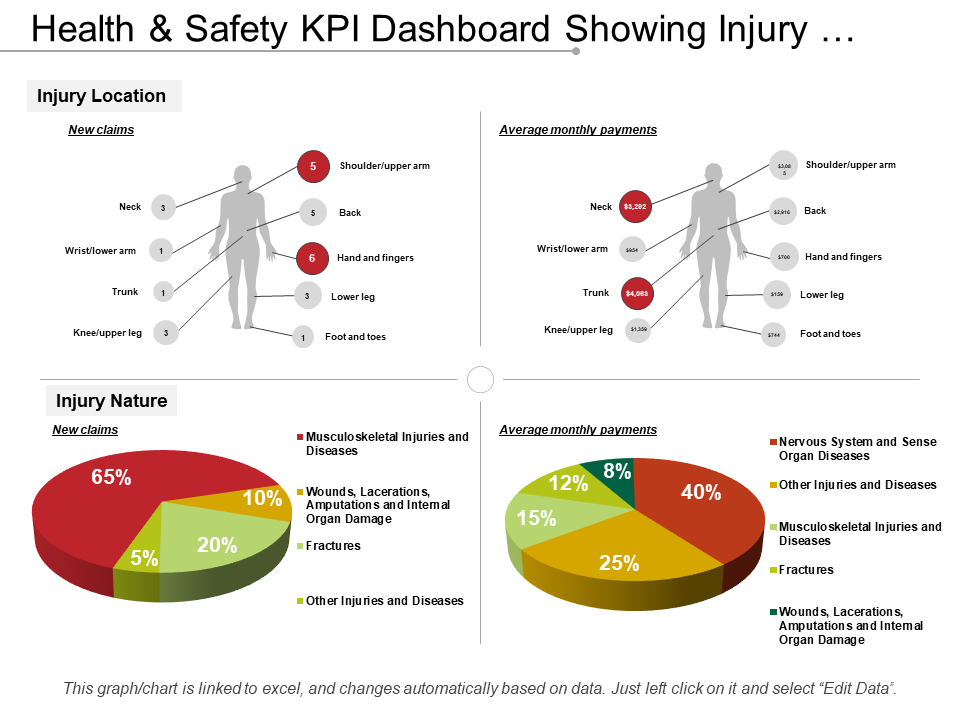
Template 5: Health and Safety KPI Dashboard Showing Injury Location and Injury Nature
This PowerPoint Slide displays a Health and Safety KPI dashboard with injury location and type, providing essential details for management, safety officials, and workers. Management obtains real-time access to safety performance, allowing for better decision-making and allocation of resources. Safety officials can see patterns, prioritize high-risk locations, and implement safety precautions. Specific strategies and enhanced training help workers by making the workplace safer. The dashboard supports an active approach to safety and health, which reduces accidents, minimizes downtime, raises morale, and protects organizations' human and financial resources. This template includes multiple diagrams and pie charts to display information for better comprehension. Grab this today!
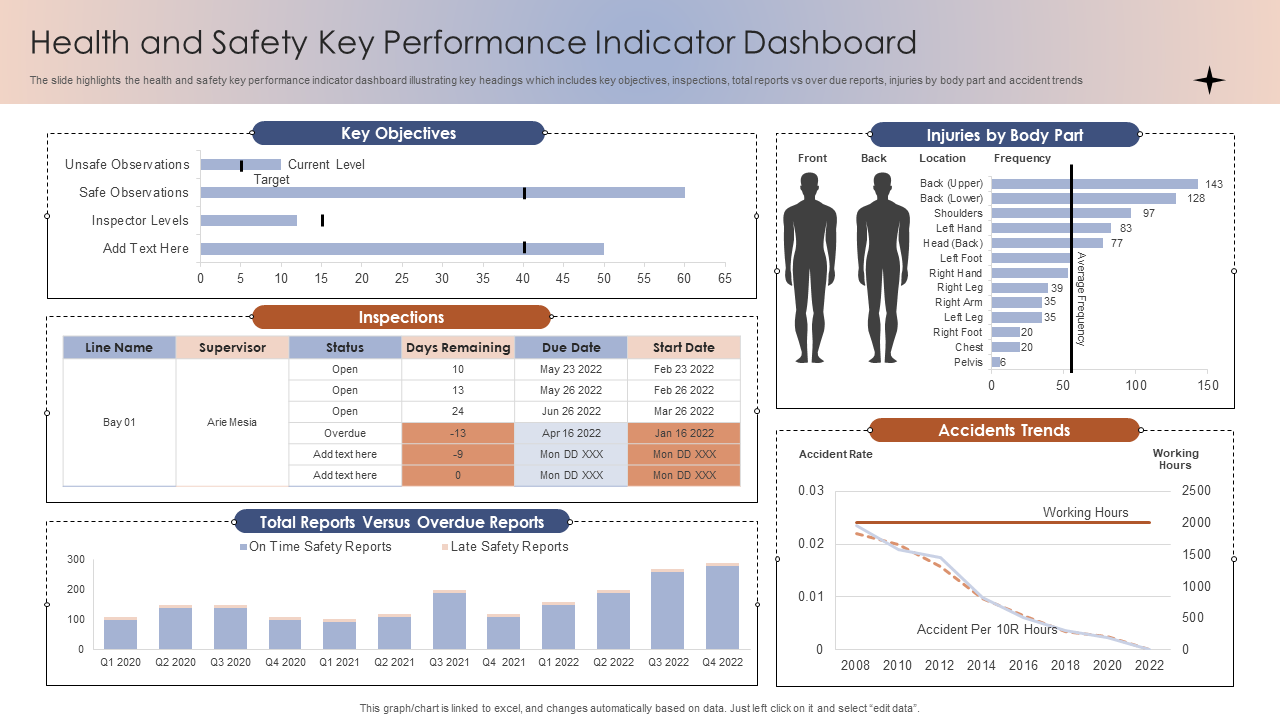
Template 6: Health And Safety Key Performance Indicator Dashboard
This PowerPoint slide illustrates key headings, which include key objectives, inspections, total reports vs. overdue reports, injuries by body part, and accident trends. It compares total and delayed reports, identifying compliance concerns. Body components break down injuries to discover common risks and prioritize prevention strategies. The information is displayed in multiple charts and diagrams for better visual appeal. It improves risk management by encouraging a data-driven approach to health and safety, enabling informed decision-making, and designing a culture of continuous improvement to create a safer work environment.
Template 7: Dashboards To Track Health and Safety KPIs Implementation of Safety Management Workplace Injuries
This PowerPoint Slide displays a dashboard with critical health and safety parameters for workplace injury management. It offers KPIs such as lost time incidents by gender, incident frequency rates in recent months, and an event breakdown by kind. This tool provides a thorough picture, quickly detecting trends and areas requiring attention. Through visual representation, stakeholders acquire essential details for informed decision-making, encouraging an active approach to safety management. The practical implementation of such dashboards improves workplace safety measures, reduces injuries, and fosters a culture of happiness and cooperation. Grab it today!
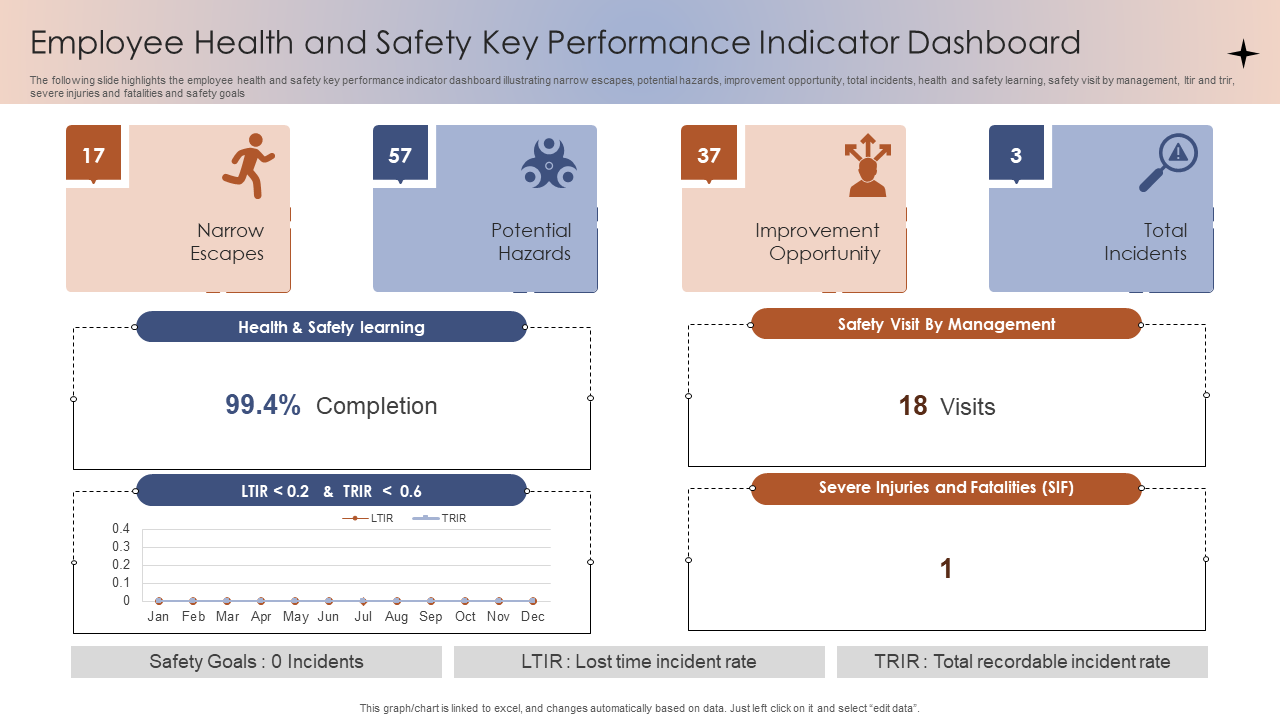
Template 8: Employee Health and Safety Key Performance Indicator Dashboard
This PowerPoint Template provides an overview of metrics for assessing workplace safety. It represents narrow escapes, potential hazards, improvement areas, and total incidents, enabling proactive risk mitigation. This slide features KPIs such as Health and Safety Learning, Management Safety Visits, Lost Time Injury Rate (LTIR), Total Recordable Injury Rate (TRIR), severe injuries, fatalities, and safety goals. This dashboard assists management in tracking progress, identifying trends, and prioritizing actions to enhance employee well-being and organizational safety culture efficiently.
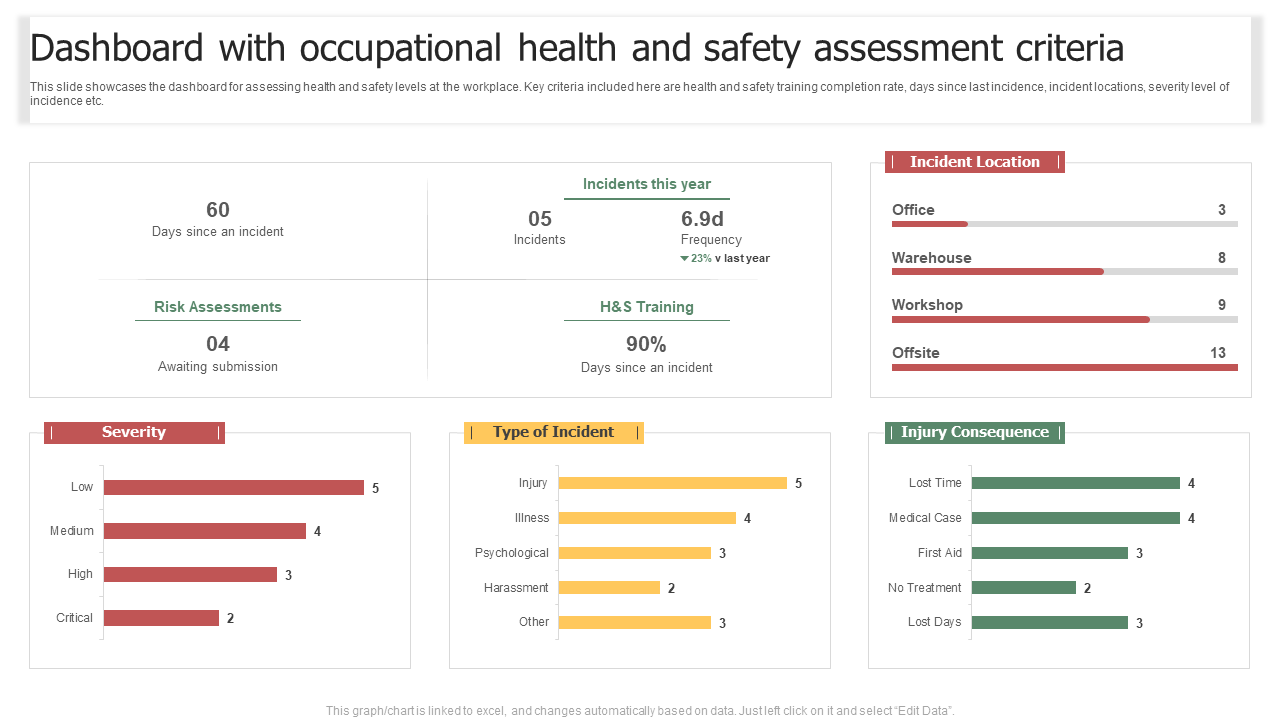
Template 9: Dashboard With Occupational Health and Safety Assessment Criteria
This PowerPoint Slide displays a dashboard with occupational health and safety factors for workplace assessment. It incorporates key parameters such as health and safety training completion rates, time since prior incidents, incident locations, and severity levels. This detailed evaluation helps management discover areas for development and assess overall safety performance. Multiple charts presented in this template are color-coded. This tool empowers decision-makers to prioritize safety measures and ensure a secure working environment.
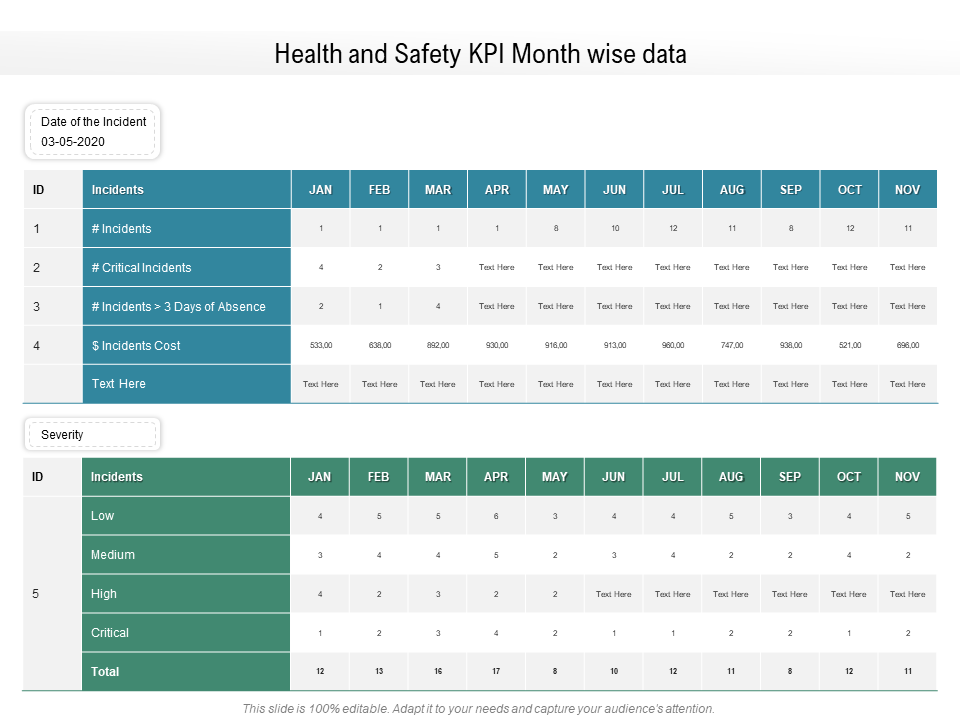
Template 10: Health and Safety KPI Month Wise Data
This PowerPoint slide provides essential measures for workplace safety, such as accident rates, near misses, and compliance adherence. These statistics help to track progress, detect patterns, and execute targeted changes. Employees benefit from a safer work environment, reduced injury risks, and improved well-being. Employers gain from fewer absences from work, cheaper insurance costs, and a better reputation for prioritizing safety. Regular monitoring enables prompt interventions and promotes a culture of ongoing growth. Finally, these KPIs help both employees and companies by saving lives, increasing productivity, and reducing liability.
Empower Safety, Elevate Performance
Organizations that prioritize Health and Safety KPIs develop a culture of safety excellence, making employees feel appreciated and protected. By thoroughly monitoring and acting on essential indicators, successful organizations reduce risks and improve productivity, morale, and overall performance. They also lay the groundwork for long-term prosperity and well-being for all stakeholders by maintaining a relentless commitment to safety.
P.S. From hazard identification to employee induction on safety to comprehensive checklists, we have the entire blueprint of health and safety plan templates. Check it out now!




 Customer Reviews

