

Cuadros de mando por función Diapositivas de presentación de PowerPoint





Try Before you Buy Download Free Sample Product
 Impress Your
Audience
 100%
Editable
 Save Hours
of Time


Perfeccione su presentación de negocios en momentos con la ayuda de las imágenes basadas en datos de Cuadros de mando por función de diapositivas de presentación de PowerPoint. Este conjunto de plantillas PPT de indicador de rendimiento todo en uno le permite mostrar datos sobre marketing y recursos humanos en la infraestructura de TI. Utilice nuestra presentación de diapositivas de PowerPoint del tablero de KPI de negocios bien estructurado para resumir la información relevante en palabras mínimas pero con el máximo efecto visual. La gerencia ejecutiva puede aprovechar nuestro tema PPT del panel de funciones para revisar los ingresos trimestrales y la descripción general del cliente. Los profesionales de negocios también pueden editar información en esta presentación de PowerPoint del panel operativo para crear una descripción general personalizada de la salud financiera. Represente las relaciones con los inversores utilizando parámetros como el rendimiento sobre el capital, la relación de capital de trabajo y el precio de las acciones a través de esta presentación de diapositivas PPT de indicadores clave de rendimiento empresarial y métricas. El personal de ventas se beneficia del rendimiento de ventas, los KPI de ventas y los diseños de la tasa de conversión del ciclo de ventas en la plantilla de PowerPoint de indicadores clave de rendimiento. Los profesionales de TI pueden mostrar información importante sobre costos, gestión de proyectos y gestión de problemas descargando este tema PPT de métricas operativas.
People who downloaded this PowerPoint presentation also viewed the following :
Contenido de esta presentación de Powerpoint
Diapositiva 1 : esta diapositiva presenta los paneles por función. Indique el nombre de su empresa y comience.
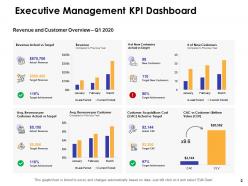
Diapositiva 2 : Esta diapositiva muestra el Panel de KPI de Gestión Ejecutiva.
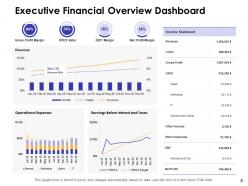
Diapositiva 3 : Esta diapositiva muestra el Panel de información financiera ejecutiva.
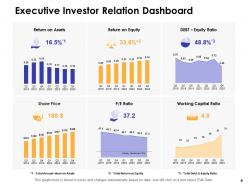
Diapositiva 4 : Esta diapositiva representa el Panel de control de relaciones con los inversores ejecutivos.
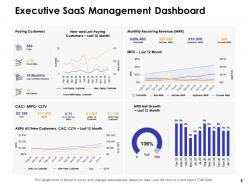
Diapositiva 5 : Esta diapositiva muestra el Panel de administración de SaaS ejecutivo.
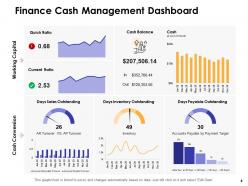
Diapositiva 6 : Esta diapositiva muestra el Panel de administración de efectivo de finanzas.
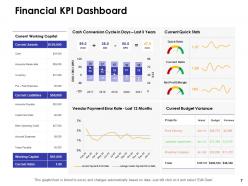
Diapositiva 7 : Esta diapositiva muestra el panel de indicadores financieros KPI.
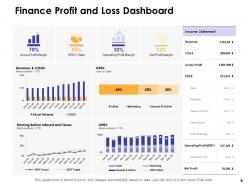
Diapositiva 8 : Esta diapositiva muestra el Panel de pérdidas y ganancias financieras.
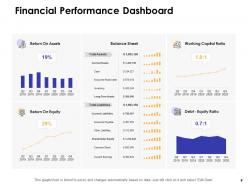
Diapositiva 9 : Esta diapositiva muestra el Panel de rendimiento financiero.
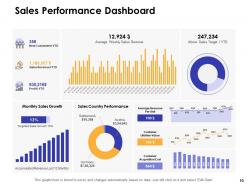
Diapositiva 10 : Esta diapositiva muestra el Panel de rendimiento de ventas.
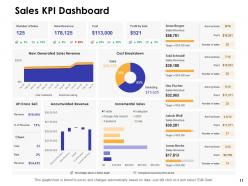
Diapositiva 11 : esta diapositiva muestra el panel de KPI de ventas.
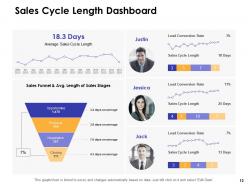
Diapositiva 12 : Esta diapositiva muestra el Panel de duración del ciclo de ventas.
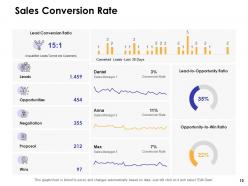
Diapositiva 13 : esta diapositiva muestra la tasa de conversión de ventas.
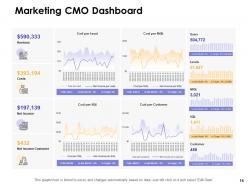
Diapositiva 14 : Esta diapositiva muestra el panel de marketing CMO
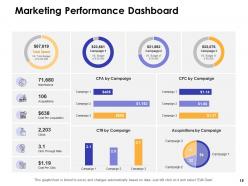
Diapositiva 15 : Esta diapositiva muestra el Panel de rendimiento de marketing.
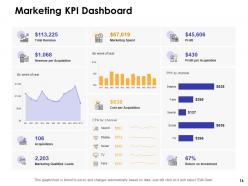
Diapositiva 16 : esta diapositiva muestra el panel de indicadores clave de rendimiento de marketing.
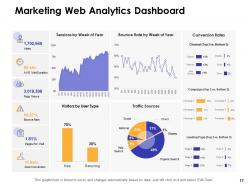
Diapositiva 17 : Esta diapositiva muestra el Panel de análisis de marketing web.
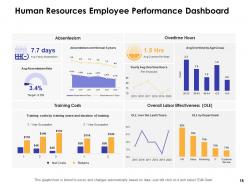
Diapositiva 18 : Esta diapositiva muestra el Panel de desempeño de los empleados de Recursos Humanos.
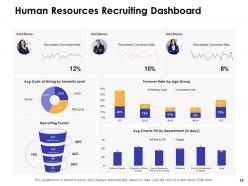
Diapositiva 19 : Esta diapositiva muestra el Panel de selección de personal de recursos humanos.
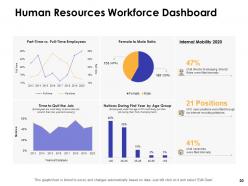
Diapositiva 20 : Esta diapositiva muestra el Panel de recursos humanos de la fuerza laboral.
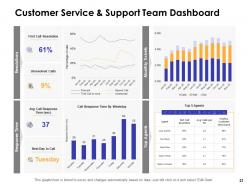
Diapositiva 21 : Esta diapositiva representa el Panel del equipo de soporte y servicio al cliente.
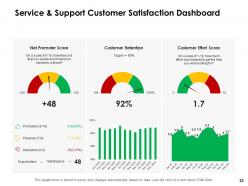
Diapositiva 22 : Esta diapositiva muestra el Panel de satisfacción del cliente de servicio y soporte.
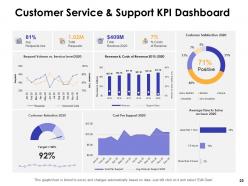
Diapositiva 23 : Esta diapositiva presenta el Panel de KPI de soporte y servicio al cliente.
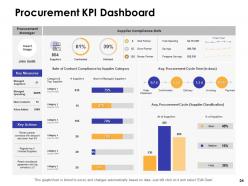
Diapositiva 24 : Esta diapositiva muestra el Panel de indicadores clave de rendimiento de adquisiciones.
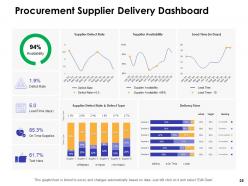
Diapositiva 25 : Esta diapositiva representa el Panel de entrega de proveedores de adquisiciones.
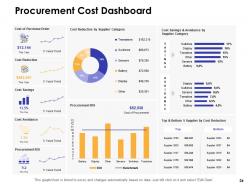
Diapositiva 26 : Esta diapositiva muestra el Panel de costos de adquisiciones.
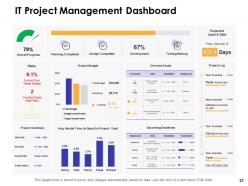
Diapositiva 27 : Esta diapositiva muestra el Panel de gestión de proyectos de TI.
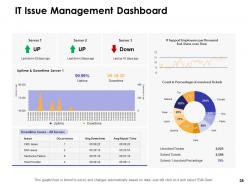
Diapositiva 28 : Esta diapositiva muestra el Panel de gestión de problemas de TI.
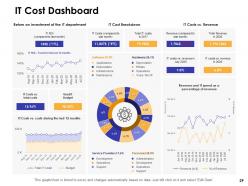
Diapositiva 29 : Esta diapositiva muestra el Panel de costos de TI.
Cuadros de mando por función Diapositivas de presentación de PowerPoint con las 29 diapositivas:
Dé la debida importancia a las contribuciones individuales con nuestras Diapositivas de presentación en PowerPoint de Dashboards By Function. Invite a la gente a participar.
FAQs for Dashboards By Function
Start with what questions people actually need answered - that's your foundation. Clean layouts and intuitive navigation are huge, plus you want charts that actually mean something to your audience. I've seen way too many dashboards that are just... information vomit everywhere. Focus on visual hierarchy so the most important stuff jumps out first. Consistent colors and clear labels help a ton. Make it interactive so people can dig deeper when they want to. Oh, and test it on mobile - half your users will probably check it on their phones anyway. Sketch out the story flow before you build anything.
Honestly, the secret is just keeping things stupid simple. Put your most important stuff at the top where people actually look. Use the same colors and fonts throughout - don't make it look like a rainbow exploded. White space is your friend! Group related stuff together so users aren't hunting around like it's a scavenger hunt. I swear, some dashboards have so many blinking widgets they'd trigger seizures. Quick test: can someone figure out what they're looking at in 5 seconds? If not, you've overcomplicated it. Oh, and consistent labels matter way more than you'd think.
Keep your color palette tight - like 3-5 colors tops. Use high contrast so people can actually read the text, and skip red/green combos since colorblind folks can't tell them apart. Fonts are where people always go overboard. Just pick one clean sans-serif like Arial and stick with it. Maybe two fonts max if you're feeling fancy. Nothing under 12pt though - I learned that the hard way when my boss couldn't read my last dashboard. Oh, and definitely test it on different screen sizes before you call it done. Trust me on that one.
So every industry basically tracks whatever keeps their business running smoothly. Healthcare places watch patient flow and how many beds are free. Retail cares about sales numbers and stock levels. Manufacturing gets crazy detailed - they're obsessed with production rates and when machines break down (I've seen some wild dashboards there). Banks focus hard on risk and compliance stuff. Delivery companies? They live and die by shipping times and route planning. The trick is picking metrics that actually help you make real decisions, not just pretty charts. What kind of business are you setting this up for?
Your dashboard's gotta be interactive or people will just ignore it. Static reports are basically useless these days - users want to click around, filter stuff, and dig deeper without bothering the data team constantly. Hover tooltips, clickable charts, dynamic filters... all that makes exploring data actually fun. Honestly, I've seen too many beautiful dashboards that nobody uses because they're just glorified posters. The trick is adding interactive bits that actually help people answer questions, not just random bells and whistles that confuse everyone.
So there are basically three types - operational, analytical, and strategic. Operational ones track real-time stuff like daily sales or system crashes. Strategic dashboards are more for the big picture KPIs that executives obsess over. Then analytical ones are for digging into historical trends (which honestly can get pretty addictive once you start finding patterns). The main thing is timing - operational is happening right now, strategic looks ahead, analytical looks back. Oh and audience matters too. You'd pick based on whether you're putting out fires, planning ahead, or just trying to figure out what the hell happened last quarter.
Honestly, the best way is tracking if people actually USE the thing - like how often they log in and how long they're on it. Time-to-insight is huge too - can someone find what they need in 30 seconds or less? But here's what really matters: are decisions getting made from the data? I've seen gorgeous dashboards that just sit there collecting digital dust. Ask users straight up every few months if it's making their job easier. Oh, and watch your business metrics - if those aren't moving, something's off. User adoption rates tell the real story.
So depends what you're after really. Tableau and Power BI are the big ones - Tableau's easier to use but costs more, Power BI's cheaper and plays nice with Microsoft stuff. Google Data Studio is free and pretty decent for basic dashboards, though it gets limiting fast. Grafana's solid for monitoring things. I swear half the companies I know pay for premium features they literally never touch. Looker's good if you need embedded analytics. But honestly? Figure out what data you actually need first, then just pick whatever fits your budget and skill level.
Yeah, multiple data sources absolutely kill dashboard speed. Each database or API you're hitting adds its own delay, and your whole thing waits for the slowest one to respond. Real-time joins make it even worse - learned that one the expensive way last quarter when our exec dashboard was taking like 30 seconds to load. Super embarrassing during board meetings! Your best bet is pre-aggregating data beforehand and maybe setting up some caching. I'd start by finding which sources are the worst offenders first.
Oh man, real-time dashboards are such a pain. Data latency is your biggest enemy - your infrastructure has to process constant streams without dying, and that gets pricey quick. Performance issues pop up constantly with high-volume sources. Data quality suffers too since there's no time to clean anything properly. Here's the thing though - most people asking for "real-time" don't actually need it. Like, seriously, would 10-15 minute delays kill them? Probably not, and it's so much easier to build and maintain. Way cheaper too. I'd push back on the real-time requirement first before diving into that headache.
Honestly, start with your most critical metrics and build validation rules around those first. You'll want to focus on three main things: validating data sources, doing regular audits, and having clear governance. Set up automated checks so errors get caught before they reach your dashboards - trust me, explaining wrong revenue numbers to the CEO is not fun. Someone needs to actually own each metric, otherwise things slip through the cracks. Document what your calculations mean too, because everyone interprets "conversion rate" differently apparently. Regular quality audits will save you headaches down the road.
Okay so the big things to watch out for are misleading visuals and privacy stuff. Don't mess with chart scales or pick weird timeframes that make your data look better than it actually is - people will make real decisions based on this! Also watch out for personal info leaking through your visualizations. I've seen teams accidentally make it possible to identify individuals, which is obviously bad. When you're rushing (and let's be honest, we always are), it's super easy to present things in a way that tells the wrong story. I always try to think - would I be okay if my boss made a big call based on how I'm showing this? Test it with real users too.
Honestly, dashboards are game-changers for making sense of your data mess. Instead of drowning in spreadsheets (ugh), you get clean visuals that show trends and problems instantly. Your whole team stays on the same page with real-time info too. Here's the thing though - don't go crazy tracking every metric under the sun. Focus on maybe 3-5 numbers that actually impact your decisions, not just stuff that looks impressive. I learned this the hard way when I first started building them. You can always add more later once you've got the basics down.
Honestly, conversational AI is where everything's headed - people want to just ask their dashboards stuff instead of clicking around forever. Real-time data streaming is massive right now, especially if you're doing ops work. Mobile design is finally catching up (seriously, took them ages). Companies are ditching the generic approach for personalized views based on what role you actually have. There's also this whole interactive storytelling thing happening with data visualization. My advice? Start playing around with chat interfaces now because users are gonna expect it pretty soon. Oh, and predictive analytics is becoming standard too - not just nice-to-have anymore.
Honestly, just set up some kind of regular check-in system - surveys, user calls, maybe monthly analytics deep-dives. Stick a feedback form right in your dashboard so people can complain in real-time (trust me, they will). Those little popup widgets are actually pretty great for catching people when they're annoyed. Keep track of the recurring complaints in a doc or whatever system you use. Then fix stuff based on what's breaking most often and hurting the most users. Oh, and this is crucial - always circle back and tell people what you changed because of their feedback. Otherwise they'll just stop bothering to help you out.
No Reviews