


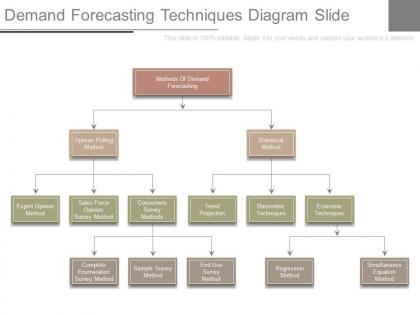
Demand forecasting techniques diagram slide




Try Before you Buy Download Free Sample Product
 Impress Your
 Audience
 100%
100% Editable
 Save Hours
 of Time


Cushion the effect with our Demand Forecasting Techniques Diagram Slide. They make it easier to digest.
People who downloaded this PowerPoint presentation also viewed the following :
Demand forecasting techniques diagram slide with all 7 slides:
Our Demand Forecasting Techniques Diagram Slide have been empowered. They have the franchise to satisfy your desire.
FAQs for Demand forecasting
Look, you've got two routes here. Qualitative stuff uses expert opinions, surveys, market research - basically human gut feelings when historical data is thin. Quantitative is all about crunching numbers from past sales using statistical models and time series analysis. Most companies I've seen do way better mixing both approaches instead of going all-in on one. New products? Go qualitative since you don't have data yet. Got years of sales history? Quantitative will be your friend. Honestly though, just work with whatever data you actually have - don't overcomplicate it.
Dude, time series analysis is a game changer for demand forecasting. Instead of staring at endless spreadsheets hoping to catch patterns, the algorithms do the heavy lifting - they automatically spot trends, seasonal stuff, and cycles you'd never notice. Way more accurate than just averaging things out. You get confidence intervals too so you actually know if your forecast is reliable or garbage. Honestly, I'd start simple with moving averages or exponential smoothing since most software already has them built in. Even learned this the hard way when I tried eyeballing data for way too long.
Dude, ML has completely changed demand forecasting. Instead of basic linear regression, you can throw massive datasets at these algorithms - sales data, weather patterns, even social media buzz - and they'll find connections you'd never spot manually. Random forests and XGBoost are solid starting points if you're new to this. Neural networks get crazy good results too. The best part? These models keep learning from fresh data, so forecasts actually improve over time. Honestly, if you're still just using moving averages, you're missing out on serious accuracy gains. Worth experimenting with at least.
Expert opinions rock when your data's sketchy or markets are doing weird stuff that spreadsheets can't catch. Way faster to get going too. Numbers-based models are solid though - they don't get moody like people do! Mixed approach works best honestly. Build your foundation with whatever quantitative data you've got, then tweak it with expert gut feelings for promotions or when competitors pull something crazy. I mean, why limit yourself to just one method? Start simple and add the human touch where it actually makes sense.
For solid demand forecasts, you'll want three main things. Historical sales data is huge - grab 2-3 years if you can. Market data comes next: economic trends, what competitors are doing, industry shifts. Then your internal stuff like promotions, marketing spend, inventory levels. Weather data is weirdly helpful too (seriously, it matters more than you'd think). The trick is mixing your historical patterns with real market intel. I'd start by checking what data you already have, then figure out which gaps would actually move the needle on accuracy. Don't overthink it initially.
Dude, seasonality will totally mess up your forecasts if you ignore it. Like, you'll end up drowning in inventory during slow months or completely sold out when demand spikes. There are some solid ways to handle this though. Seasonal decomposition separates trends from seasonal stuff, which is pretty neat. Holt-Winters exponential smoothing works great too, and seasonal ARIMA if you want to get fancy. Honestly? Even just comparing to the same month last year beats pretending seasonality doesn't exist. Just plot your historical data first - you'll see the patterns jump out at you. Then pick whatever method matches your situation.
So economic indicators are like your crystal ball for demand forecasting - they show market shifts before your sales data catches up. GDP growth, unemployment, consumer confidence all directly mess with how much people actually spend. Interest rates are massive too since they hit everything from houses to cars. You want to focus on stuff that matters for your specific industry though - housing starts if you're in construction, disposable income for luxury items, whatever. The real game-changer is actually building these into your forecasting models instead of just looking at past sales. Honestly, I'd start with maybe 3-4 indicators that historically match your demand patterns.
Dude, collaborative forecasting is actually game-changing. Instead of guessing alone, you're getting intel from suppliers, retailers, the whole chain. Real-time market data your team would never see otherwise. Plus honestly, your partners will love the transparency - makes future negotiations way smoother. Those crazy demand swings that mess up your whole supply chain? Way less of an issue when everyone's on the same page. Your inventory gets more nimble, you catch trends faster. I'd say start with maybe 2-3 key partners first, then expand once you've got some wins to show for it.
So basically you want to create 3-5 different demand scenarios - think best case, worst case, and what'll probably happen. First figure out what could really mess with your numbers (competitors, economy tanking, seasonal stuff). Build your forecasts around those drivers. Honestly, it's way less intimidating once you start doing it. I was overwhelmed at first too. Just pick three scenarios to begin with so you don't go crazy with options. The real trick is updating them when new info comes in - otherwise you're just guessing with old data. You'll end up with a range instead of one magic number that's probably wrong anyway. Way better than being blindsided.
Look, when demand gets super jumpy, your forecasts basically become garbage. Moving averages? Forget it - they're always playing catch-up while you're left scrambling. You'll want exponential smoothing or maybe some ML models that actually react to changes. The annoying part is volatile demand means bigger safety stock, so more cash tied up (ugh). I'd measure your coefficient of variation first though. Above 0.5? Time to ditch those basic methods and get something that can handle the chaos.
Dump your sales data into some predictive models - they're pretty good at catching patterns you'd miss otherwise. Seasonal stuff, growth trends, how that random promotion last spring boosted everything. Time series analysis is your friend here. Excel works fine to start, honestly don't overthink the tech part. You need at least a year or two of clean data though, otherwise you're just guessing. Pick your easiest product categories first - the ones that actually make sense. Build models there, see what works. Then tackle the weird stuff once you've got some wins under your belt. Way less frustrating that way.
Honestly, data quality is gonna be your biggest headache. Garbage data = garbage forecasts, period. Then you've got all these systems that barely talk to each other, which makes integrating everything a total mess. But here's the thing - sometimes the people problems are worse than the tech ones. Sales teams love their gut instincts and don't want some algorithm telling them what to do. Operations expects crystal ball-level accuracy that just isn't realistic. My advice? Fix your data first, even if it's boring work. Everything else falls apart without clean inputs anyway.
Honestly, visual analytics is a game changer for demand forecasting. Instead of staring at endless spreadsheet rows (which makes my eyes cross), you get actual charts and dashboards that tell the story instantly. Seasonal patterns jump out at you. Outliers become obvious. Heat maps show which products are tanking or crushing it unexpectedly. I'm obsessed with time series plots because they catch those cyclical patterns you'd totally miss otherwise. Interactive stuff lets you dig into specific months or categories when something looks weird. Start simple with line charts, then get fancy with filters once you're hooked.
Start with MAE and MAPE - those are your bread and butter. MAE shows your average miss in real units, MAPE gives you percentage accuracy so you can compare different products. Forecast bias is crucial too because nobody wants to be consistently over or under (learned that the hard way). Oh, and track forecast value add to see if your fancy models actually beat basic ones. Honestly, I've seen people obsess over like 12 different metrics when these four tell you everything you need. If your forecasting isn't helping the business, you'll know pretty quick with this setup.
Honestly, the biggest thing is getting different people in the room - sales teams are always way too optimistic (I've learned this the hard way), while finance people basically expect the apocalypse. Try the Delphi method where everyone submits forecasts anonymously first, then you hash it out together. Also track your past predictions and see where you consistently mess up. Most companies don't even realize they're biased until they actually document their assumptions. Once you spot the patterns, you'll start catching yourself before making the same mistakes again.
-
Excellent work done on template design and graphics.
-
Best Representation of topics, really appreciable.
-
Great quality slides in rapid time.
-
Great quality slides in rapid time.