

Apresentação de slides de previsão financeira





Try Before you Buy Download Free Sample Product
 Impress Your
 Audience
 100%
100% Editable
 Save Hours
 of Time


Nosso Slides de Apresentação de Previsão Financeira são projetados topicamente para fornecer um pano de fundo atraente para qualquer assunto. Use-os para parecer um profissional de apresentação.
People who downloaded this PowerPoint presentation also viewed the following :
Conteúdo desta apresentação em PowerPoint
Slide 1: Este slide apresenta a Previsão Financeira. Declare o Nome da Sua Empresa e comece.
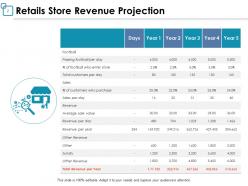
Slide 2: Este slide mostra a Projeção de Receita da Loja de Varejo descrevendo - clientes por dia, vendas, receita, etc.
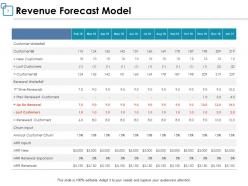
Slide 3: Este slide apresenta o Modelo de Previsão de Receita descrevendo - Funil de Clientes, Funil de Renovação, Entrada de Abandono, Abandono Anual de Clientes, etc.
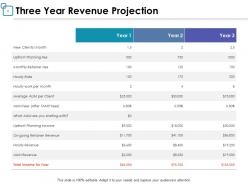
Slide 4: Este slide exibe a Projeção de Receita de Três Anos descrevendo - Novos clientes, taxa de planejamento inicial, taxa de retenção mensal, renda de planejamento inicial, etc.
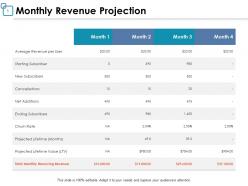
Slide 5: Este slide representa a Projeção de Receita Mensal descrevendo - receita média por usuário, assinante inicial, novos assinantes, adições líquidas, taxa de abandono, etc.
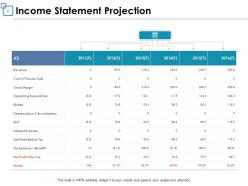
Slide 6: Este slide mostra a Projeção da Demonstração de Resultados descrevendo - Receita, Custo dos Produtos Vendidos, Margem Bruta, Despesas Operacionais, etc.
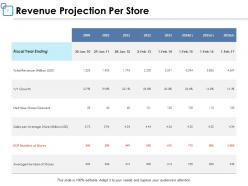
Slide 7: Este slide mostra a Projeção de Receita Por Loja descrevendo - Receita Total, Novas Lojas Abertas Líquidas, Vendas por Loja Média, etc.
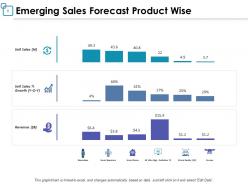
Slide 8: Este slide apresenta a Previsão de Vendas Emergentes Por Produto descrevendo - % Crescimento de Vendas Unitárias, Receita, Vendas Unitárias.
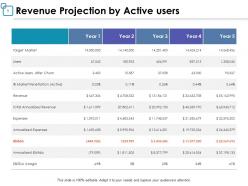
Slide 9: Este slide exibe a Projeção de Receita por Usuários Ativos descrevendo - Mercado-Alvo, Usuários, Receita, Despesas, etc.
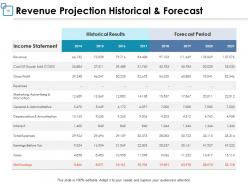
Slide 10: Este slide representa a Projeção de Receita Histórica e Prevista com Demonstração de Resultados, Resultados Históricos e Período de Previsão.
Slide 11: Este slide é intitulado como Slides Adicionais para Avançar.
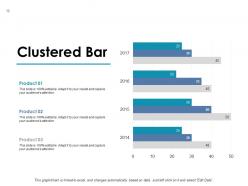
Slide 12: Este slide mostra um Gráfico de Barras Agrupadas com comparação de três produtos.
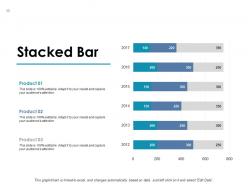
Slide 13: Este slide mostra um Gráfico de Barras Empilhadas com comparação de três produtos.
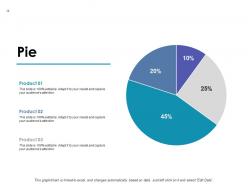
Slide 14: Este slide exibe um Gráfico de Rosca com comparação de quatro produtos.
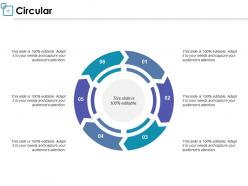
Slide 15: Este slide mostra um Diagrama Circular com caixas de texto.
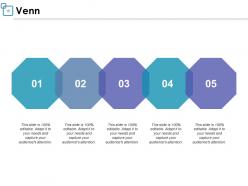
Slide 16: Este é um slide de Venn com caixas de texto para mostrar informações.
Slide 17: Este é um slide de Matriz com caixas de texto adicionais.
Slide 18: Este é um slide de Lego com caixas de texto adicionais para ir.
Slide 19: Este é um slide de Agradecimento com endereço, números de contato e endereço de e-mail.
Previsão Financeira Slides de Apresentação do PowerPoint com todas as 16 slides:
Utilize nossos slides de apresentação em PowerPoint de Previsão Financeira para economizar seu tempo valioso de forma eficaz. Eles estão prontos para se encaixar em qualquer estrutura de apresentação.

FAQs for Financial Forecast
You'll want to start with revenue projections - honestly the hardest part since you're basically guessing what'll happen. Then figure out your fixed costs, variable expenses, and any big purchases coming down the line. Cash flow and balance sheet projections come next. Oh, and definitely run a few scenarios - like what happens if things go amazing vs. totally sideways vs. somewhere in between. The trick is being honest with your numbers and writing down how you calculated stuff. Trust me, future you will thank you when it's time to update everything and you can't remember why you thought you'd make $50K in month two.
Look at your last 3-5 years of data first - that's where you'll see the patterns that actually matter. Revenue growth, seasonal dips, spending cycles. They tend to repeat themselves, which is honestly pretty helpful for planning ahead. Don't just copy those growth rates though. Things change - new competitors pop up, markets shift, your company pivots. I learned this the hard way during COVID when everything went sideways. Plot your key metrics on a timeline and see what's been consistent. Then adjust for whatever's different now. Historical trends are super useful, but they're more like guidelines than rules.
So market analysis is basically your financial forecasting compass - it shows you what external stuff will mess with your numbers. You're digging into industry trends, how competitors are doing, economic signals, customer habits. All to predict revenue and cost impacts. It's like checking weather before a picnic, but way messier and involves way too many spreadsheets (honestly, why are there always so many spreadsheets?). Without decent market research, you're just making educated guesses from internal data. Find 3-5 key market drivers that actually correlate with your business performance historically.
Your spreadsheets won't catch everything - that's where qualitative stuff comes in. Management quality, market vibes, regulatory shifts, competitive threats. Numbers might look solid, but what if the new CEO is trash? I've watched so many "perfect" models completely whiff on industry disruptions or changing consumer habits. Honestly, people get way too confident in their projections sometimes. Use those insights to reality-check your assumptions and widen your confidence ranges. Next time you're forecasting, just write down 3-5 major qualitative risks first.
Honestly, I'd start simple with linear regression and scenario planning - way easier to sell to your boss. Time series stuff like moving averages and ARIMA models are super common for forecasting. Regression helps you figure out which variables actually matter. Monte Carlo simulations are pretty cool too, basically running thousands of probability scenarios at once. Machine learning is trendy right now, especially if you've got messy data. But seriously, don't jump into the fancy stuff first. Get people comfortable with basic "what if" modeling, then you can introduce the more complex methods once everyone's on board.
So basically, economic indicators are what feed into your forecast assumptions - they're the outside stuff that shapes your internal numbers. GDP growth hits your revenue projections. Inflation messes with costs. Interest rates affect financing and discount rates. Employment data shows consumer spending trends, which is massive for B2C companies. Here's the thing though - you can't just dump these indicators straight into your models. There are lag effects, plus each industry reacts differently. Honestly, I'd start by figuring out which 3-4 indicators have historically moved with your business performance.
Here's the thing - startups have zero data while big companies are sitting on years of sales history. You're basically guessing based on market research and what similar companies did, which can feel pretty sketchy tbh. Established businesses? They've got seasonal patterns, customer trends, all that good stuff to actually predict what's coming. Your forecasts will definitely be wrong at first (mine always were), so just plan to update them every month as real numbers roll in. Build in wiggle room from day one.
Honestly, the difference is night and day. Machine learning picks up on patterns in your data that you'd never catch manually - market trends, seasonal stuff, weird correlations between factors. No more staying up late making spreadsheet errors either (we've all been there). The software runs multiple scenarios at once and updates everything as new info comes in, which is pretty sweet. I'd start with forecasting tools that plug into whatever financial systems you're already using. Way less time spent on number crunching, way better accuracy.
Yeah, seasonality and cyclical stuff will mess up your projections big time if you ignore them. Like retail always spikes in Q4, tourism goes crazy in summer - those seasonal patterns are pretty predictable once you spot them. Cyclical trends are more annoying though, they stretch over years and tie into broader economic cycles. I totally whiffed on this once with a construction project because I didn't think about how cyclical that industry is! Honestly, you need at least 3-5 years of historical data to catch these patterns. Way better than just assuming everything grows in a straight line, which never happens anyway.
Honestly, don't wait around for those quarterly reviews when the market's shifting under your feet. Jump on updates right away. Set up alerts for stuff like customer demand changes, what competitors are doing, economic weirdness - whatever actually moves your numbers. Trust me, we got burned last year sitting on stale forecasts way too long. Focus on your biggest 2-3 revenue and cost drivers instead of fiddling with every tiny line item (that's just busy work anyway). Make it a monthly thing so you're not constantly scrambling to catch up with reality.
Oh man, don't get too rosy with your numbers - that's like the
-
Editable templates with innovative design and color combination.
-
Helpful product design for delivering presentation.
-
Very well designed and informative templates.
-
Easily Editable.
-
Colors used are bright and distinctive.