

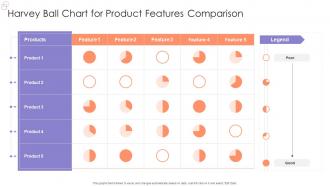
Harvey Ball Chart For Product Features Comparison





Try Before you Buy Download Free Sample Product
 Impress Your
Audience
 100%
Editable
 Save Hours
of Time


Our Harvey Ball Chart For Product Features Comparison are topically designed to provide an attractive backdrop to any subject. Use them to look like a presentation pro.
People who downloaded this PowerPoint presentation also viewed the following :
Harvey Ball Chart For Product Features Comparison with all 7 slides:
Use our Harvey Ball Chart For Product Features Comparison to effectively help you save your valuable time. They are readymade to fit into any presentation structure.






FAQs for Harvey Ball Chart For
Oh, Harvey Ball charts! Those are the circle icons that show progress - empty, quarter-filled, half, three-quarters, or full. Super simple but honestly pretty effective. Named after the smiley face creator (weird flex, Harvey). You see them everywhere in dashboards and status reports. Way better than throwing percentages at people, especially when you're comparing a bunch of different things. Executives love them because they get the gist instantly without getting bogged down in details. Perfect for those "how are we doing" conversations where you just need the quick visual story.
Oh those are just pie charts but way simpler - they only show how "full" something is instead of breaking down different categories. Picture a gas gauge but for data. You get these clean circles that are partially filled in. Way less cluttered than bar charts or those messy line graphs. They're honestly perfect for dashboards when you want to show stuff like completion rates, how satisfied customers are, or progress toward some goal. People can read them instantly without doing any math in their head. I use them all the time for status updates.
Dude, Harvey Ball charts are seriously underrated. They show progress at a glance - like you instantly know if something's 25% done or almost finished just by how full the circle looks. Way better than making people squint at spreadsheets or decode fancy graphs. I actually prefer them over bar charts sometimes because they're just... friendlier? Your boss can scan them in two seconds instead of analyzing a bunch of numbers. Perfect for project updates, satisfaction scores, that kind of stuff. They make reports so much easier to digest.
Harvey Ball charts are great for showing completion levels or satisfaction ratings when you want quick comparisons. Perfect for dashboards or project updates where people need to see how "full" different categories are at a glance. I use them for stuff like quarterly goals, customer satisfaction by region, or skill assessments. Anyone can read them instantly - no studying percentages required. They're honestly way better than boring bar charts for this kind of thing. Use them when you want your audience spotting patterns fast, but skip them if you need super precise data points.
Excel's probably your easiest bet - most people already have it and you can mess around with pie charts or progress bars to get the effect. PowerPoint works too, especially if you just use their shape tools to draw circles and fill them partially. Google Sheets is solid for collaboration stuff. Honestly, I've watched people get super creative with this - Tableau, Canva, even just the basic drawing tools in PowerPoint. The trick is finding anything that'll let you make circles and fill them partway. Which sounds obvious when I say it like that, but you'd be surprised how many programs can do it. Start with whatever you're comfortable using and go from there.
Oh man, Harvey Ball charts are everywhere once you notice them! Consulting firms like McKinsey throw them into basically every client deck - perfect for showing capability gaps or how you stack up against competitors. Software companies are obsessed with them too for feature comparisons. Market research people use them constantly for brand studies and customer satisfaction stuff. I swear half the executive presentations I've seen have at least one slide with those little circles. They're honestly genius for any qualitative data that would otherwise be a boring table. Super clean way to show "we're good at this, terrible at that" without getting into the weeds.
Make them the same size and stick to simple fills - quarters, halves, three-quarters. People can actually see those differences without squinting. Don't go crazy with categories either, 5-7 max or you'll lose people. Honestly, skip the weird percentages like 37% because nobody can tell that from 40% anyway. Use the same colors throughout and throw in a legend so people know what they're looking at. Oh, and organize your rows somehow - alphabetically or by how well things are doing. Makes it way easier to spot patterns. I learned this the hard way after making some truly confusing charts last year.
Honestly, Harvey Ball charts are pretty flexible once you get into them. Colors are your best friend - stick with stuff that makes sense, like green for good results and red for problems. Make them big enough that people can actually see what's going on. I'm obsessed with adding little gradients or drop shadows because they just look so much better than flat circles. You can mess around with how many segments you want too - quarters work fine for basic stuff, but eighths give you more precision. Oh, and don't forget labels! A legend helps, but I usually slap percentage numbers right on the balls themselves. Way clearer that way.
Colors make or break Harvey Ball charts - seriously. Go with something intuitive like red to green or light to dark. Random colors just confuse people, and honestly, that defeats the whole purpose. You want instant understanding, right? Keep it to 3-5 colors tops. Also don't forget about colorblind folks when picking your palette. I always run mine by someone else first because sometimes what looks obvious to you doesn't click for others. The goal is making data super easy to read at a glance.
Harvey Balls are basically visual percentages - they show you completion or performance at a quick glance. So an empty circle is 0%, quarter-filled is 25%, half is 50%, and so on up to 100%. You'll see them everywhere in project dashboards because honestly, they're way faster to scan than reading a bunch of numbers. Each circle represents some metric or category you're tracking. The filled portion shows how complete or well-performing that thing is. When you're looking at them, scan for patterns and spot anything that's seriously lagging behind the rest.
Dude, the worst thing you can do is cram like 20 Harvey Balls on one slide. People's eyes just glaze over trying to figure out if that three-quarter circle is better than the half-filled one. Keep it to maybe 5-7 max. Oh, and define what "full" actually means right off the bat - is it 100% done? Perfect score? I've watched entire meetings where people just stared confused at circles. Don't make them tiny either (learned that the hard way when presenting to a packed conference room). Stick with basic colors and always throw in a legend. Trust me on this one.
Harvey Ball charts are perfect for dashboards when you want quick status updates. Stick them next to your usual bar charts and tables. Tableau and Power BI both support them - Excel too if you're stuck with that. Executives absolutely eat these up because they don't have to think hard to understand them. Works great for showing completion rates or performance scores. Just don't use them when people need exact numbers. They're more about the "how full is this?" vibe than precise data. Third-party plugins make setup pretty painless if your BI tool doesn't have them built-in.
Harvey Ball charts suck for precise comparisons - like, 23% vs 27% looks identical when you're just eyeballing filled circles. No way to show trends or data relationships either. Plus they look kinda old-school now? Your audience will definitely struggle without visible numbers or scales. Short sentences work better with bar charts or line graphs when you need accuracy. Honestly, stick to Harvey Balls only for basic yes/no type stuff or simple categories where being exact doesn't matter much.
Yeah, this stuff gets tricky when you're dealing with different cultures. Western people read left-to-right and think green = good, red = bad. But that's totally backwards in some places - like red's actually lucky in China. Also, not everyone reads the same direction we do. The whole "more filled = better" thing? Doesn't translate everywhere either. I learned this the hard way on a project last year. Your best move is throwing in clear labels and legends. Maybe add some arrows too if you're presenting to a mixed crowd. Sounds obvious but you'd be surprised how many people skip this step.
Dude, Harvey Ball charts are honestly game-changers for quick decisions. Just fill circles (quarter, half, full) to show how options perform across different criteria. Way better than drowning in spreadsheet numbers. Perfect when you're comparing vendors or trying to get everyone on the same page about trade-offs. I mean, who doesn't instantly understand what a half-filled circle means? The patterns jump out at you immediately. Next time you're overthinking a decision, try mapping everything with Harvey Balls - I swear you'll reach consensus so much faster than traditional scoring methods.
-
Love how there are no boring templates here! The design is fresh and creative, just the way I like it. Can't wait to edit and use them for my extended projects!
-
I was confident and well prepared for my presentation for the first time ever. With SlideTeam’s templates, I could deliver one of my best presentations. Will be coming back for more!