


Sales and logistics process flow charts




Try Before you Buy Download Free Sample Product
 Impress Your
 Audience
 100%
100% Editable
 Save Hours
 of Time


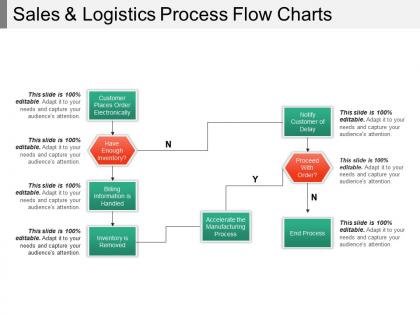
Introducing Sales And Logistics Process Flow Charts template.Highlight the steps of transportation and market planning using this PPT graphic. Improve profitability and supply chain efficiency by incorporating four key logistics goals in this PPT visual. Explain supply chain process in detail with this Sales and marketing process PPT Presentation. In this logistic sale visual, you can describe market and sales strategy to overcome common sales problems faced by companies. Employ this marketing background image to depict the important role of Information Technology in supply operations. Understand common buying processes in transportation and help to set up successful sales with this template. Ensure that all the decisions are taken after a thorough consideration of all available options by utilizing this inventory management visual. Showcase the applications of automated inventory management system to save time and to increase data accuracy. Hence, generate maximum business revenue by downloading this readymade logistic sales training PowerPoint Presentation.
People who downloaded this PowerPoint presentation also viewed the following :
Sales and logistics process flow charts with all 5 slides:
Our Sales And Logistics Process Flow Charts have a functional format. They are designed for your convenience.


FAQs for Sales and logistics
Here's what I'd focus on: order entry/processing, inventory checks, picking and packing, shipping, and customer communication. Payment processing and returns handling are crucial too - honestly, those bite you when you least expect it. Map out the decision points where things can go sideways, like low inventory or order changes. Teams need to see exactly where handoffs happen. Oh, and sketch your current mess first (we all have one). Find your bottlenecks before you design the dream flow. That's where the real wins are hiding.
Honestly, flowcharts are game-changers for this stuff. Your sales team stops saying vague things like "get it there fast" while logistics actually knows what's expected. Everyone can see who does what and when - no more of those awkward moments where both teams thought the other was handling something. When things inevitably go wrong (because they always do), you can spot exactly where it broke down instead of everyone pointing fingers. We had this problem at my last job too. Get both teams together first and map out what you're actually doing now.
Honestly, just start with draw.io (now called diagrams.net) - it's completely free and does everything you need. Lucidchart's really nice too if you want more templates and better collaboration stuff. Visio's the gold standard but only if your company's already paying for Microsoft 365, otherwise it gets pricey fast. You could even use PowerPoint in a pinch, though that feels a bit janky for anything complex. The main thing is making sure everyone on your sales team can actually get into it and make edits. I'd mess around with the free options first - you might be surprised how far they go before you need to spend money.
So sales logistics charts are just the customer-facing stuff - like how orders flow from when someone first contacts you through delivery and after. General logistics? That's your whole operation. Procurement, warehousing, all the behind-the-scenes stuff customers don't see. Sales logistics shows order processing times, when you communicate with customers, delivery confirmations - basically the customer journey. General logistics maps everything else. Here's what works: start from your customer's viewpoint and work backwards. You'll catch communication gaps or service issues that might be costing you deals. Honestly, most people skip this step and wonder why they're losing customers.
Honestly, you'll see problems so much faster with visuals than drowning in spreadsheet hell. Flowcharts are a lifesaver for training new people - nobody's reading those massive procedure docs anyway. Real-time dashboards let you catch issues before they blow up into actual crises. Patterns jump out at you immediately when everything's mapped out properly. Bottlenecks become obvious. I'd start with basic process flows first, then add your performance numbers on top. Way easier than staring at endless rows of data hoping something clicks.
Dude, flow charts are like having superpowers for finding bottlenecks. You literally see where stuff gets stuck - orders waiting forever for approval, inventory checks dragging on, whatever. Map out your sales process step by step and the problem areas basically scream at you. I always time each step first, then hunt down the biggest delays. You'll catch redundant steps, pointless handoffs between teams, things that should run parallel but don't. Honestly beats staring at spreadsheets trying to guess what's broken. Focus on the longest delays first - that's your biggest bang for the buck.
Start with the customer's journey and work backwards - that's honestly the best approach. Simple shapes work way better than anything fancy. Keep your decision points super clear with yes/no branches. I've seen so many flowcharts that look like total chaos! Each box should have maybe 3-4 words max. Show handoffs between teams clearly since that's usually where everything falls apart. Test it with someone who doesn't know your process - if they're confused, you need to simplify more. Anyone should get it in 30 seconds or less.
Map out your current process first - where are the bottlenecks and decision points? Figure out which steps will hit their limit when things get busy. Most people skip this step honestly, but it'll save you later. Build in parallel pathways for when volume spikes, and add spots where you can drop in extra people or automation. The trick is setting up branches that kick in automatically based on how swamped you are. Oh and definitely test it with fake scenarios before you're drowning in real work. Trust me on that one.
Track your cycle times and where stuff gets stuck between steps - that's where you'll find your real problems. Order processing speed, inventory rates, and how often you mess up orders are huge indicators. Customer touchpoints matter too since those always create the biggest fires to put out. Map out how long each process takes right now, then go after your worst time wasters first. Lead times from order to delivery and error rates at each stage will tell you everything. Oh, and don't forget resource utilization - you'd be surprised how much that reveals about bottlenecks.
Dude, flow charts are seriously perfect for training new sales logistics people. Instead of drowning them in some massive manual nobody reads anyway, you get this visual map of the whole process. New hires can actually see how order intake connects to fulfillment and delivery. Walking through real scenarios becomes way easier when you've got the chart right there. Short sentences work better than long explanations, honestly. They'll reference it later when they're working alone and can't remember if shipping approval comes before or after inventory check - trust me, that confusion happens more than you'd think.
Honestly, don't wait for some scheduled review - update those flow charts right when you change something important. Order routing gets tweaked? Shipping procedures change? Fix the charts within a week or two max. I've watched teams mess up constantly because they're following outdated flows. Monthly check-ins are smart even when nothing big happens - you'll catch weird little changes that somehow crept in. Minor stuff can probably wait, but anything touching department handoffs or customer timing? Yeah, that needs updating ASAP. Trust me on this one.
Honestly, the biggest pain is when your flowcharts turn into spaghetti monsters that nobody can follow. Sales processes have so many "what if" scenarios and exceptions - it gets messy fast. Plus keeping everything updated is a nightmare since things change weekly. Your warehouse guys might look at your symbols completely differently than customer service does. I learned this the hard way last year. Start simple with the big picture stuff first, then only get into the weeds where you actually need to. Way less headache that way.
Definitely get your team involved - they're the ones dealing with this stuff daily and will spot things you'd never think of. I'd grab people from different departments too since everyone sees their own piece of it. Ask them to actually walk through real situations, not just theoretical ones. That's where you'll find the weird workarounds nobody talks about. Can't tell you how many "perfect" flowcharts I've seen that were completely useless because nobody checked with the actual users first. Set up regular check-ins so they can flag changes as things evolve. Processes never stay static anyway.
Honestly, those flowcharts work really well as visual roadmaps connecting customer orders to your whole upstream process. Map your sales flow directly onto inventory planning and procurement schedules - you'll spot bottlenecks between what sales promises and what you can actually deliver. They're also perfect for getting everyone on the same page during meetings (beats those never-ending email threads, trust me). The trick is overlaying your current sales flowchart with your supply chain map. Gaps become super obvious that way. Start there and you'll get real visibility into how orders ripple through everything.
Honestly, throwing real case studies into your flow charts is a game changer. People actually get it when you reference that disaster order from Q3 instead of just showing boring boxes and arrows. You know what I mean? Show them the "why" behind each step using stuff they've lived through. Bottlenecks become obvious. Decision points make sense when there's context. I'd stick maybe 2-3 mini examples in callout boxes - don't go overboard. Your team will actually pay attention to the chart instead of glazing over during meetings.
-
Great experience, I would definitely use your services further.
-
Innovative and attractive designs.