


Presentación de diapositivas de PowerPoint sobre el dimensionamiento del mercado





Try Before you Buy Download Free Sample Product
 Impress Your
 Audience
 100%
100% Editable
 Save Hours
 of Time


Mucho antes de que una empresa comience a estimar el tamaño del mercado, es muy importante recopilar los datos relacionados en formato de plantilla de PPT relacionados con el estudio del potencial de mercado. Otros parámetros como la definición del público objetivo, la tasa de penetración y el tamaño potencial del mercado se pueden abordar con facilidad en una Presentación de PowerPoint de Dimensionamiento de Mercado. En lo que respecta a la asignación de la empresa en el tamaño total del mercado, se puede medir por las estadísticas del volumen total debidamente actualizadas en la plantilla de presentación. El manejo de números y otras partes de cálculo se han vuelto muy fáciles, ya que todas las tablas de medición y fórmulas están respaldadas en la presentación de diapositivas de PowerPoint. En una sala de conferencias, los aspectos cualitativos y cuantitativos se pueden manejar, llevar a la atención y evaluar con facilidad utilizando gráficos prediseñados en el diseño de PPT. Incluso antes de lanzar un nuevo producto o servicio, es importante entender el potencial de mercado con respecto a su empresa, todo lo cual se puede rastrear con la diapositiva de presentación, ayudándolo así a estar a la par con los demás. Asegúrese de que se consideren debidamente los sentimientos étnicos con nuestras Diapositivas de Presentación de Dimensionamiento de Mercado de PowerPoint. Ser capaz de abordar las preocupaciones culturales.
People who downloaded this PowerPoint presentation also viewed the following :
Contenido de esta presentación de Powerpoint
Antes de que una empresa dé un paso adelante, ingrese a un nuevo dominio comercial, lance un producto o servicio, alquile una propiedad o contrate personal, intenta aprender todo lo que puede sobre el mercado. El dimensionamiento y estudio del mercado ayudan a allanar el camino para la nueva cosa que desea comenzar.
A veces, la gerencia le pide a un asociado senior o ejecutivo experimentado en la organización que les brinde los detalles requeridos relacionados con el dimensionamiento del mercado. Como el dimensionamiento del mercado es un aspecto sensible y altamente derivativo, el ejecutivo puede parecer estar en problemas mientras recopila y analiza los detalles relacionados con el dimensionamiento del mercado. Si usted es uno de esos ejecutivos, entonces lo que puede ayudarlo es una plantilla lista para usar relacionada con el concepto.
La plantilla 100% personalizable y adaptable de SlideTeam sobre dimensionamiento de mercado contiene la munición requerida para reducir los enormes aspectos de este concepto. Utilizando esta plantilla, puede mostrar los aspectos críticos, datos y otra información relacionada con el mercado y presentarlos de manera integral ante la gerencia.
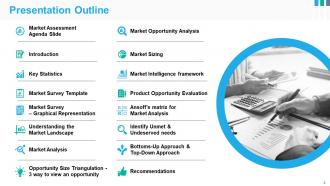
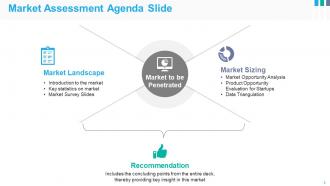
La plantilla contiene todo, desde detalles conceptuales hasta la agenda, desde estadísticas clave hasta ideas de la encuesta, y mucho más. Entonces, sin más preámbulos, aprendamos sobre las principales ofertas de la plantilla a continuación para que pueda usarla para su beneficio con facilidad.
Plantilla 1: Plantilla de encuesta de mercado
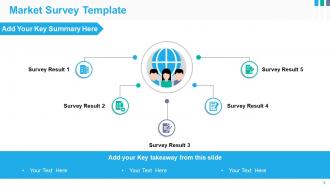
El dimensionamiento del mercado no se puede hacer con precisión sin una encuesta(s) de mercado. Por lo tanto, esta plantilla le permite resumir y mostrar los tipos de encuestas realizadas en el mercado, así como sus hallazgos. Puede utilizar la estructura infográfica de esta plantilla para abordar lo que encontró antes y después de realizar las encuestas. Para una mejor y más rápida comprensión de la audiencia, también puede agregar el resumen clave de las encuestas en la parte superior de la plantilla.
Plantilla 2: Encuesta de mercado - Representación gráfica
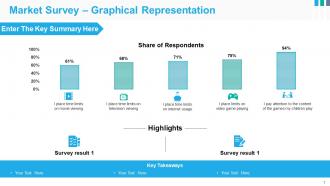
Los miembros del equipo de gestión o su audiencia pueden necesitar una visión más profunda de los hallazgos de su encuesta. Por lo tanto, esta plantilla ayuda a presentar los hallazgos de la encuesta de mercado gráficamente. Puede utilizar el gráfico de barras presente en la plantilla para mostrar los hallazgos. El eje y del gráfico le ayudará a registrar la intensidad del cambio o los hallazgos. También puede agregar el resumen clave en la parte superior de la plantilla, así como incluir otros dos hallazgos importantes en la parte inferior.
Plantilla 3: Comprender el panorama del mercado
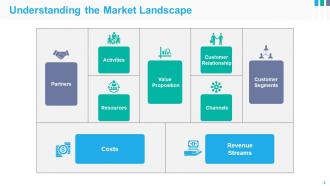
Para mostrar con éxito los dominios relacionados con su investigación de mercado, puede utilizar esta diapositiva. Cubrir un amplio panorama de mercado es un elemento crucial del dimensionamiento del mercado. Esta diapositiva le permite agregar tantos elementos de paisaje como desee a los informes de dimensionamiento del mercado. Aquí, puede agregar elementos como la cantidad de socios en el mercado, todas las actividades y recursos involucrados, el valor propuesto, los patrones de relación con los clientes, los canales de distribución, los segmentos de clientes y varios otros.
Plantilla 4: Análisis de mercado
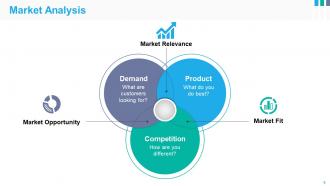
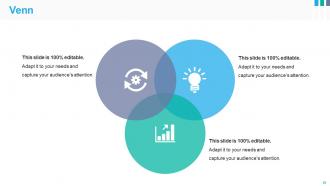
Aquí hay una diapositiva importante en la plantilla de dimensionamiento de mercado que le permite mostrar los informes de análisis de mercado de manera ideográfica. La diapositiva muestra un diagrama de Venn que representa tres elementos diferentes del análisis de mercado, a saber, Demanda (lo que quieren los clientes), Producto (lo que puede ofrecer) y Competencia (lo que lo hace único). Las áreas de intersección representan la información relacionada con el Ajuste de mercado, la Oportunidad de mercado y la Relevancia de mercado con respecto a cada elemento de la demanda del mercado disponible.
Plantilla 5: Análisis de oportunidades de mercado - Plantilla 1
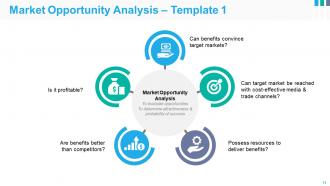
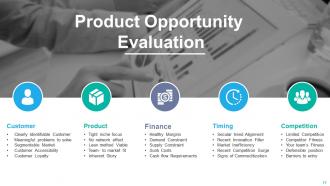
Una vez que haya realizado y mostrado con éxito los hallazgos de la encuesta de mercado, es posible que necesite ayuda para representar sus informes de análisis de oportunidades de mercado. Esta parte de la plantilla de dimensionamiento de mercado puede ayudarlo con esta tarea. Aquí, puede responder preguntas como: ¿Los beneficios pueden convencer al mercado objetivo? ¿Se puede llegar al mercado objetivo de manera rentable? ¿Es rentable? ¿Posee su negocio los recursos necesarios para satisfacer las expectativas de los clientes?
Plantilla 6: Dimensionamiento de mercado - Plantilla 1
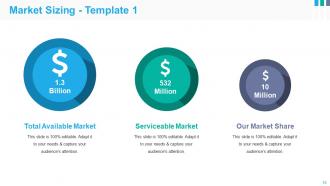
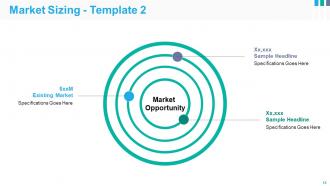
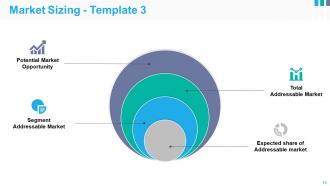
Ahora que ha mostrado el análisis de oportunidades de mercado, es hora de pasar a la parte de dimensionamiento de mercado de la plantilla. Con la ayuda de esta diapositiva, puede iluminar a la audiencia sobre el tamaño total del mercado disponible dentro del alcance del negocio, el mercado de servicios disponible a su disposición y la participación de mercado que su negocio cubre o gobierna actualmente. Puede representar estos datos en forma de burbujas, y cada burbuja contendrá un tamaño de mercado de millones o miles de millones de dólares.
Plantilla 7: Marco de inteligencia de mercado
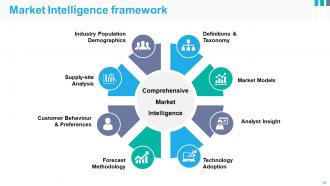
Utilizando esta diapositiva de la plantilla de dimensionamiento de mercado, puede iluminar a la gerencia sobre el marco general de inteligencia de mercado. Aquí, puede mostrar que la información proporcionada a la audiencia se ha entregado considerando las Definiciones y Taxonomía, Modelos de Mercado, Visión de Analista, Adopción de Tecnología, Metodología de Pronóstico, Comportamiento y Preferencias del Cliente, Análisis del Lado de la Oferta y Demografía de la Población de la Industria. Puede agregar o eliminar tantos materiales del marco como sea necesario, dependiendo de la investigación de mercado que realizó y sus hallazgos generales.
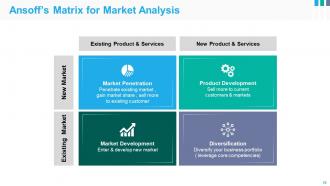
Plantilla 8: Matriz de Ansoff para análisis de mercado
La matriz de Ansoff es una herramienta de análisis confiable y muy confiable que ayuda a las empresas y su personal a comprender los patrones del mercado y elaborar planes en consecuencia. Puede utilizar la matriz de Ansoff proporcionada en esta plantilla de dimensionamiento de mercado para entregar información relacionada con los productos y servicios existentes, así como con los nuevos productos y servicios con respecto a los hallazgos del nuevo mercado y el mercado emergente. Para iluminar aún más a la gerencia sobre el concepto, puede agregar texto de apoyo.
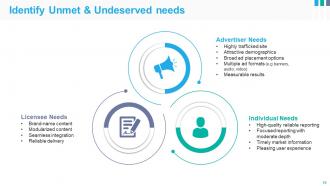
Plantilla 9: Identificar necesidades no satisfechas y desatendidas
A continuación, en la plantilla de dimensionamiento de mercado, hay una diapositiva que le permite mostrar las necesidades de los anunciantes, las necesidades de licencia y las necesidades individuales derivadas del análisis. Las necesidades de los anunciantes pueden incluir requisitos como sitios con mucho tráfico y demografía atractiva. De manera similar, las necesidades de licencia pueden incluir encabezados como contenido de marca y contenido modularizado. Por último, las necesidades individuales pueden incluir elementos como informes de alta calidad e informes enfocados con profundidad moderada.
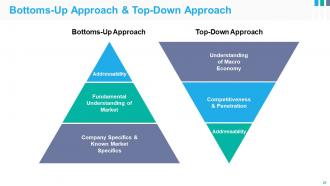
Plantilla 10: Enfoque de abajo hacia arriba y enfoque de arriba hacia abajo
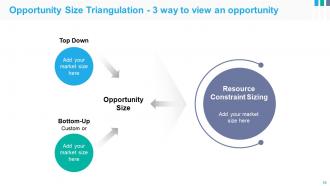
Para mostrar los hallazgos del dimensionamiento del mercado, puede utilizar enfoques de abajo hacia arriba y de arriba hacia abajo. Ambos enfoques son altamente derivativos y, por lo tanto, importantes de incluir en los hallazgos. El enfoque de abajo hacia arriba contiene la abordabilidad en la parte superior, luego una comprensión fundamental del mercado en el medio, y las especificaciones de la empresa y las especificaciones del mercado conocido en la parte inferior del embudo. De manera similar, el enfoque de arriba hacia abajo contiene una comprensión de la economía macro en la parte superior, la competitividad y la penetración en el medio, y la abordabilidad en la parte inferior del embudo.
Análisis de mercado facilitado con la plantilla de dimensionamiento de mercado
El dimensionamiento del mercado puede ser solo una parte del dominio del análisis de mercado, pero juega un papel fundamental para obtener información relacionada con el mercado. La plantilla anterior puede ayudarlo a mostrar sus hallazgos del análisis de mercado y el dimensionamiento de mercado en mayor medida para el beneficio del negocio.
Presentación de diapositivas de PowerPoint sobre dimensionamiento de mercado con las 44 diapositivas.
Atraer a más gente con nuestras Diapositivas de Presentación de Dimensionamiento de Mercado. Más personas asistirán a sus eventos.












FAQs for Market Sizing
Honestly, start with bottom-up if you can - way more realistic than those fancy industry reports. First figure out who you're actually selling to, then count how many of those people exist. Grab data from wherever you can find it, but don't just trust the first numbers you see. Talk to real customers to check if your math makes sense. Oh and definitely compare against what competitors are doing - sometimes that's the reality check you need. Biggest thing? Don't fall in love with your first estimate. I've seen people get super attached and miss obvious red flags.
Honestly, you need both - they work really well together. Secondary research first (industry reports, government stats, competitor stuff) gives you the foundation. It's boring as hell but super useful for baseline numbers. After that, do primary research with surveys or interviews to check if your assumptions are actually right. Secondary helps you understand the big picture, then primary fills in the gaps with real customer feedback. Oh and definitely do secondary first - it'll help you ask way better questions when you get to the primary stuff. Makes everything more focused instead of just shooting in the dark.
Look into TAM, SAM, and SOM - yeah I know, more acronyms. TAM is basically everyone who could ever want your product. SAM narrows that down to people you can actually reach with your current setup. SOM is what you'll realistically grab considering competitors aren't just gonna roll over. Honestly, SAM is probably where you should start since it's the most useful for actual planning. Also keep an eye on how fast your market's growing and what it costs to snag new customers. The whole framework sounds super corporate but it actually helps you think through things properly.
Think of TAM/SAM/SOM like a funnel. TAM is the total market if literally everyone bought your product. SAM gets more realistic - what slice can you actually serve based on geography, your business model, etc. SOM is what you'll realistically capture given your budget and competition. Coffee shop example: TAM = all global coffee sales. SAM = Seattle's coffee market. SOM = maybe 2% of that with your single location. Honestly, most founders I know totally inflate their SOM numbers because they want to impress investors. Don't do that. Just work down from solid data for each layer and be real about your constraints.
Honestly, competitor analysis is like your sanity check for market sizing. Look at their revenue numbers, customer counts, market share - whatever you can dig up. Cross-reference that stuff with your estimates so you don't end up with totally bonkers projections. Their pricing and where they operate also shows you how the market actually splits up. I always try to find at least 2-3 competitors with solid data to compare against. Trust me, it's way better to catch unrealistic numbers early than pitch something that makes investors roll their eyes. Plus it's probably the most straightforward way to validate your assumptions anyway.
Dude, consumer trends totally mess with market projections because they flip demand on its head. Historical data becomes pretty much worthless. Look at video conferencing - who saw that 2020 explosion coming? Your 2019 numbers would've been laughably wrong. I always check search trends and early pilot results for clues. You've got to factor in stuff like changing preferences, new tech adoption, demographic shifts. The tricky part is staying flexible with your assumptions instead of clinging to old models. Honestly, behavioral changes are where most people get blindsided in market sizing.
Biggest mistake? Being stupidly optimistic about your TAM. Don't fall into that "if we capture just 1% of this huge market" nonsense - I see this constantly and it never works out. Always validate with actual data instead of guessing. Bottom-up analysis beats top-down every time, especially when you can get real customer info. Focus on the market you can actually reach, not some fantasy global number. Oh, and talk to potential customers first - sounds obvious but most people skip this step. That reality check will save you from looking ridiculous later.
Yeah so it totally depends on the industry you're looking at. Tech moves crazy fast so you're basically guessing based on user growth and whatever digital data you can find. Healthcare though? That's a nightmare with all the patient studies and regulatory stuff you have to dig through. Retail's actually not bad since there's tons of sales data and foot traffic info out there. Oh and your timelines are gonna be totally different too - tech changes every few months but healthcare takes forever. I'd honestly just pick whichever one has the best public data available first.
SurveyMonkey and Typeform are solid for customer surveys. Google Analytics is free and gives decent web traffic data. I live in Excel way too much building models, but honestly it's perfect for the bottom-up math stuff. IBISWorld and Statista cost money but they're goldmines for industry data. PitchBook rocks for startup/VC market info if you can get access. Actually, start with free tools first - you'd be surprised what you can piece together just using Google, census data, and a decent spreadsheet. Build from there once you know what gaps you're trying to fill.
Dude, you'll want to ditch the usual market reports for emerging markets - they're either ancient or nonexistent. Primary research is your best bet. I got burned by this in Southeast Asia, so trust me on this one. Local surveys and interviews beat fancy reports every time. The informal economy stuff? Traditional methods completely miss it, which is honestly crazy given how huge it is in these regions. Your assumptions from developed markets won't work here - purchasing power operates totally differently. Oh, and start small with test markets first. Way less risky than going big right away.
Dude, charts and graphs are a game-changer for market sizing presentations. People's eyes glaze over the second you start rattling off numbers - trust me, I've been there. Waterfall charts work great for showing your calculation process, and pie charts make those TAM/SAM/SOM breakdowns super clear. Bar graphs are perfect for growth projections too. Honestly, anything beats another boring spreadsheet walkthrough. Your audience will actually remember what you're saying instead of checking their phones. Makes the whole thing way more convincing when stakeholders can see the relationships between market segments at a glance.
Honestly, just build it into your routine instead of panicking later when numbers look weird. I'd do quarterly reviews for most stuff, maybe twice a year if your market's pretty stable. Google Trends is solid for catching early shifts - though obviously don't make it your only source. Set up alerts for your main segments and always double-check big changes against other data. Track the obvious stuff: new competitors popping up, regulatory tweaks, customer behavior changes. A simple dashboard works better than anything fancy. The whole point is spotting problems before someone corners you asking "wait, is this still right?"
So yeah, GDP growth usually means bigger markets because people have more cash to spend. Pretty straightforward stuff. But honestly, don't just look at the headline GDP number - that's kinda lazy. You want GDP per capita and how income's actually distributed. Like, if only the top 1% are getting richer, that doesn't help much if you're selling everyday products. Also check which sectors are actually growing in your area. I always throw in demographic trends too because sometimes those matter more than the economic data. Makes the whole picture way clearer.
You can't just look at your whole market and call it a day - you'll end up with totally useless numbers. Break it down by geography, demographics, whatever makes sense for your business. Like instead of "all small businesses need this," try "retail shops under 50 employees in cities." Way more realistic. I learned this the hard way when I was doing projections last year and my numbers were completely off. Pick 2-3 ways to slice your market that actually matter for how you operate. Then size each chunk separately. Trust me, it's so much better than guessing.
Dude, market sizing is basically your cheat sheet for not wasting money. You figure out the total addressable market, then get real about what slice you can actually grab. Is dropping $2M worth it for a $50M opportunity vs a $500M one? Pretty obvious when you put it that way. It helps justify hiring more people, pick which projects to prioritize, and set revenue goals that won't make your CFO roll their eyes. Think of it like checking GPS before a road trip - I mean, you could just drive around aimlessly but why would you? Start big with TAM, then work down to what's actually realistic.
-
Very unique, user-friendly presentation interface.
-
Great product with highly impressive and engaging designs.