


Visão geral mensal dos negócios Slides de apresentação em PowerPoint






Try Before you Buy Download Free Sample Product
 Impress Your
 Audience
 100%
100% Editable
 Save Hours
 of Time


Examine as vendas e o crescimento do seu negócio com nossos slides de apresentação em PowerPoint da visão geral mensal dos negócios. Ajuda a garantir a execução adequada dos planos estratégicos de negócios definidos, bem como dos planos operacionais. Este projeto PPT de revisão mensal de negócios rentável retratará a idéia de realização de negócios, mas os métodos para medidas de dissecação de negócios exatas e eficazes. Além disso, esclarece diferentes outros componentes relacionados à revisão de negócios com nosso modelo de apresentação, por exemplo, ajuda na tomada de decisões competentes, persuade os funcionários a ter um melhor desempenho, aumenta a taxa de contentamento do cliente, ajuda a atingir os objetivos de negócios, dá novas oportunidades de negócios e em breve. Esta apresentação de visão geral do negócio é bastante extensa e mostra a taxa de desenvolvimento mensal da sua empresa para os stakeholders e investidores. Os slides mensais do PowerPoint da Visão Geral da Empresa ajudam ainda mais a fornecer a posição precisa de sua empresa no setor em vigor. Portanto, obtenha este layout de apresentação exclusivo e avalie o desempenho da estrutura da sua organização. Nossos slides de apresentação em PowerPoint da Visão geral do negócio mensal preencherão as lacunas. Eles garantem que tudo esteja completo.
People who downloaded this PowerPoint presentation also viewed the following :
Conteúdo desta apresentação em PowerPoint
Slide 1 : Este slide apresenta a Visão Geral Mensal dos Negócios. Informe o nome da sua empresa e comece.
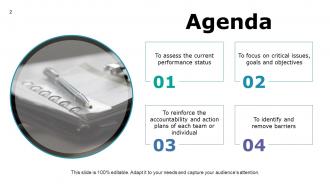
Slide 2 : Este é um slide da agenda. Tem as seguintes características- Para avaliar o estado de desempenho atual, Para focar em questões críticas, metas e objetivos, Para reforçar a responsabilidade e planos de ação de cada equipe ou indivíduo, Para identificar e remover barreiras.
Slide 3 : Este slide apresenta o Índice. Você pode adicionar o título e começar.
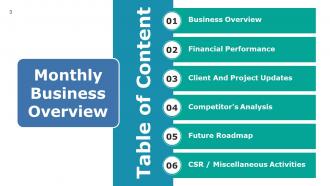
Slide 4 : Este também é um slide de Índice. Use-o para mostrar o seguinte - Visão Geral do Negócio, Desempenho Financeiro, Atualizações do Cliente e do Projeto, Análise do Concorrente, Roteiro Futuro, CSR / Atividades Diversas.
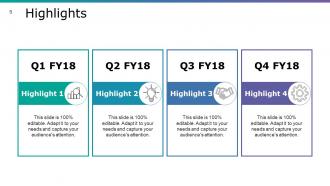
Slide 5 : este é um slide de destaques com imagens de ícones para mostrar.
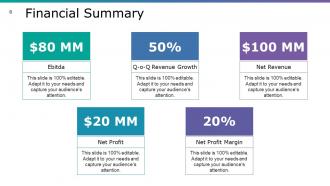
Slide 6 : Este é um slide de Resumo Financeiro. Use-o para indicar aspectos financeiros como - Ebitda, Lucro líquido, Crescimento da receita no trimestre, Margem de lucro líquido, Receita líquida.
Slide 7 : Este slide mostra a Divisão de Receita - Por Geografia em uma imagem de mapa mundial.
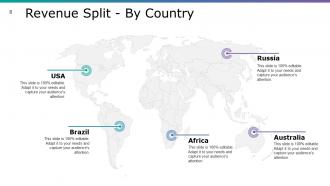
Slide 8 : Este slide mostra a divisão da receita - por país em uma imagem de mapa mundial.
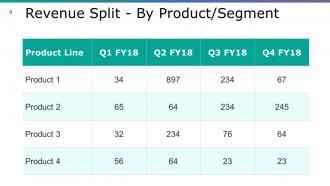
Slide 9 : Este slide mostra a Divisão de Receita - Por Produto / Segmento em uma forma tabular.
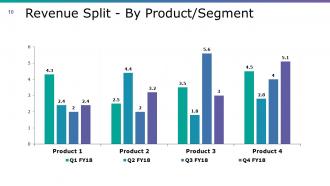
Slide 10 : Este slide também mostra a Divisão de Receita - Por Produto / Segmento em um gráfico de barras / formulário.
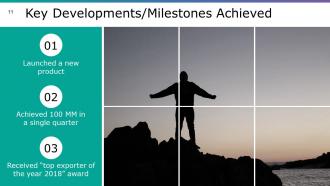
Slide 11 : Este slide mostra os principais desenvolvimentos / marcos alcançados com imagens. Use-o para indicar os principais desenvolvimentos ou marcos alcançados por sua empresa, como - Lançamento de um novo produto, Alcançou 100 MM em um único trimestre, Recebeu o prêmio de “maior exportador do ano 2018”.
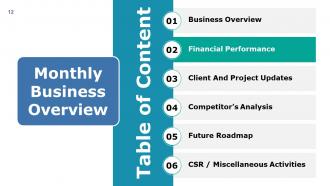
Slide 12 : Este slide também mostra o Índice. Use-o para mostrar o seguinte - Visão Geral do Negócio, Desempenho Financeiro, Atualizações do Cliente e do Projeto, Análise do Concorrente, Roteiro Futuro, CSR / Atividades Diversas.
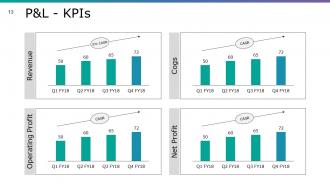
Slide 13 : Este é o slide P&L - KPIs em um gráfico de barras / gráfico.
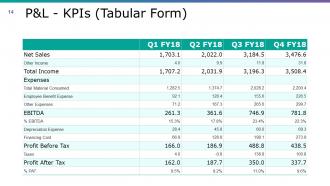
Slide 14 : Este slide também mostra P&L - KPIs em uma forma tabular.
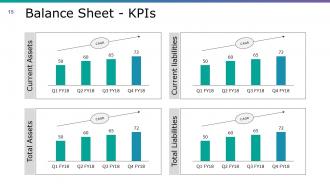
Slide 15 : Este slide mostra o Balanço Patrimonial - KPIs. Os subtítulos incluídos são - Ativo Circulante, Ativo Total, Passivo Circulante, Passivo Total.
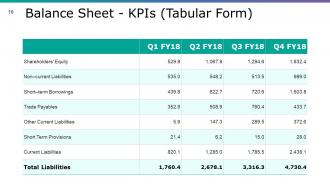
Slide 16 : Este slide mostra o Balanço Patrimonial - KPIs em uma forma tabular.
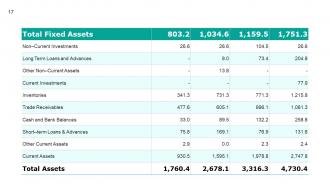
Slide 17 : Este slide mostra o total de ativos fixos em uma forma tabular.
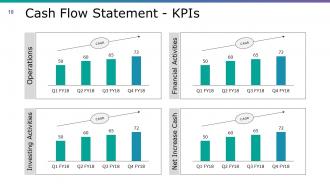
Slide 18 : Este slide mostra a Demonstração do Fluxo de Caixa - KPIs em forma de gráfico. Os constituintes incluem: Operação, Atividades de Investimento, Atividades de Financiamento, Aumento Líquido de Caixa.
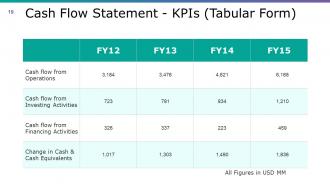
Slide 19 : Este slide apresenta a Demonstração do Fluxo de Caixa - KPIs em uma forma tabular.
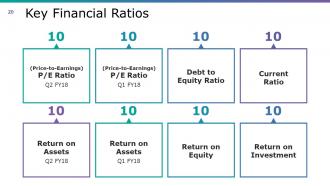
Slide 20 : Este slide mostra os principais índices financeiros, como Índice P / L, Índice dívida / patrimônio, Índice atual, Retorno sobre o investimento, Retorno sobre ativos, Retorno sobre patrimônio líquido.
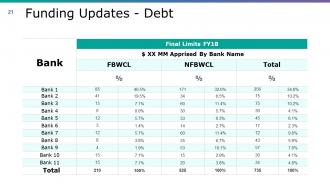
Slide 21 : Este slide apresenta as Atualizações de Financiamento - Dívida em uma forma tabular.
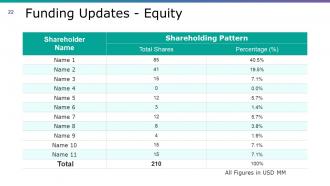
Slide 22 : Este slide mostra as Atualizações de Financiamento - Patrimônio Líquido. Apresente os dados aqui em uma forma tabular.
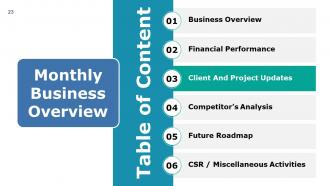
Slide 23 : Este slide é intitulado Índice para indicar.
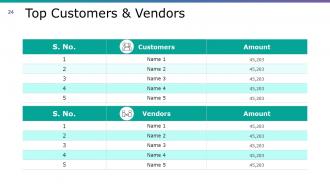
Slide 24 : Este slide mostra a tabela de Principais clientes e fornecedores. Use-o para indicar seus clientes, fornecedores, etc.
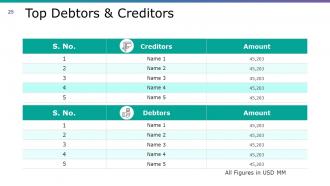
Slide 25 : Este slide mostra os Principais Devedores e Credores em uma forma tabular. Use-o de acordo com sua necessidade.
Slide 26 : Este slide mostra as atualizações dos clientes com relação a - Principais clientes adquiridos, Novos clientes adquiridos.
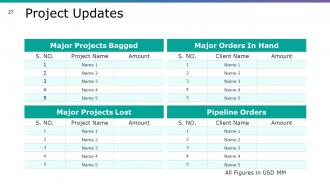
Slide 27 : Este é um slide de atualizações do projeto. Apresente as atualizações relacionadas ao projeto em uma forma tabular aqui.
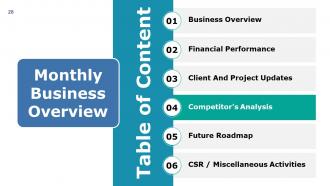
Slide 28 : Este slide apresenta a Visão Geral Mensal dos Negócios com Índice. Os pontos são: Visão Geral do Negócio, Desempenho Financeiro, Atualizações do Cliente e do Projeto, Análise do Concorrente, Roteiro Futuro, CSR / Atividades Diversas.
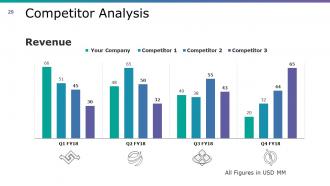
Slide 29 : Este slide mostra a Análise do Concorrente em um gráfico de barras / gráfico.
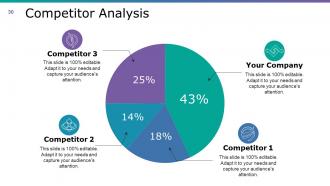
Slide 30 : Este slide mostra a análise do concorrente mostrando o custo dos produtos vendidos.
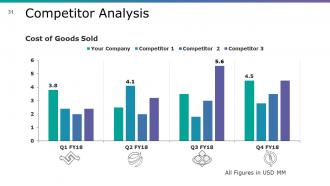
Slide 31 : Este slide também mostra a Análise do Concorrente em um gráfico de barras / gráfico.
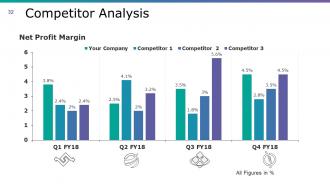
Slide 32 : Este slide apresenta a Análise da Concorrência mostrando a Margem de Lucro Líquido.
Slide 33 : Este slide apresenta a Matriz de Inteligência Competitiva de Benchmarking em termos de parâmetros de Qualidade e Alto-Baixo.
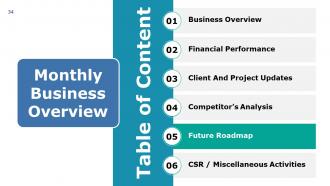
Slide 34 : Este slide exibe a Tabela de Conteúdo da Visão Geral Mensal dos Negócios com o seguinte - Visão Geral dos Negócios, Desempenho Financeiro, Atualizações do Cliente e do Projeto, Análise do Concorrente, Roteiro Futuro, CSR / Atividades Diversas.
Slide 35 : Este slide mostra o plano de 30-60-90 dias. Declare isso aqui.
Slide 36 : Este slide mostra Lâmpada com idéias de planejamento de tempo com imagens e caixas de texto.
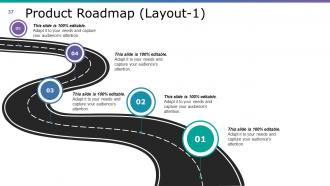
Slide 37 : Este slide mostra um Roteiro do Produto com imagens. Use-o para definir marcos etc. aqui.
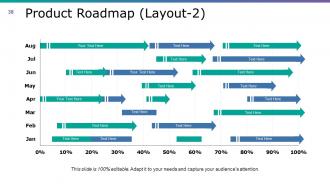
Slide 38 : Este também é um slide do Roteiro do produto. Estabeleça marcos etc. aqui.
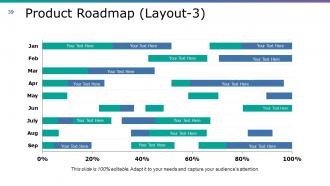
Slide 39 : Este slide também mostra um Roteiro de Produto em formato de raia. Estabeleça marcos etc. aqui.
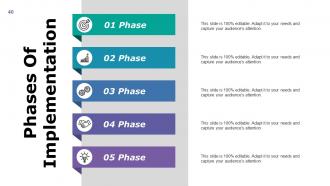
Slide 40 : Este slide mostra as fases de implementação. Estado fases aqui.
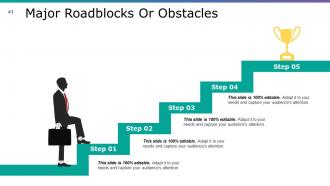
Slide 41 : Este slide mostra os principais obstáculos ou obstáculos nas silhuetas das pessoas e caixas de texto para acompanhar.
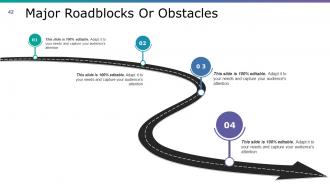
Slide 42 : Este slide também mostra os principais obstáculos ou obstáculos em um formulário de roteiro.
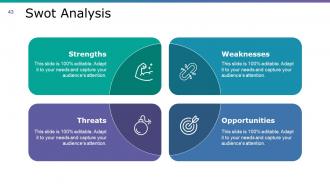
Slide 43 : Este slide mostra a Análise Swot com imagens de ícones e caixas de texto.
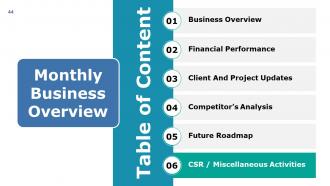
Slide 44 : Este slide mostra o Índice para uma Visão Geral Mensal dos Negócios. Os conteúdos são: Visão Geral do Negócio, Desempenho Financeiro, Atualizações do Cliente e do Projeto, Análise do Concorrente, Roteiro Futuro, CSR / Atividades Diversas.
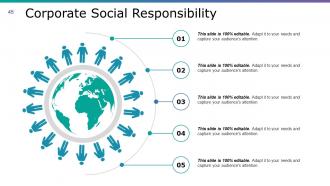
Slide 45 : Este slide mostra a Responsabilidade Social Corporativa com imagens criativas e caixas de texto.
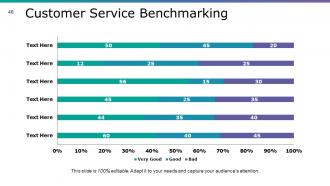
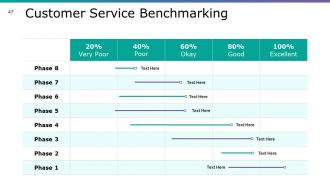
Slide 46 : Este slide mostra o Benchmarking de Atendimento ao Cliente em termos de Muito Bom, Bom, Ruim em forma de gráfico.
Slide 47 : Este slide mostra outra variação do Benchmarking de Atendimento ao Cliente em termos de Muito Bom, Bom, Ruim.
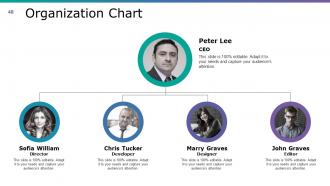
Slide 48 : Este slide mostra o organograma com nome, designação, etc. Use-o para apresentar a hierarquia de sua organização.
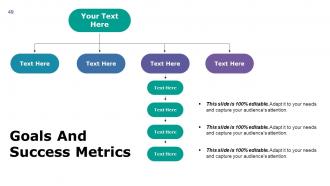
Slide 49 : Este é o slide Metas e métricas de sucesso em um fluxograma. Declare-os aqui.
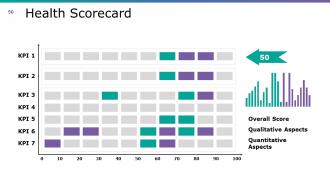
Slide 50 : Este é um slide do Scorecard de Saúde mostrando - Pontuação Geral, Aspectos Qualitativos, Aspectos Quantitativos.
Slide 51 : Este é um slide de imagem do Coffee Break para parar. Você pode alterar o conteúdo do slide conforme a necessidade.
Slide 52 : Este slide é intitulado Tabelas e gráficos para avançar. Você pode alterar o conteúdo do slide conforme a necessidade.
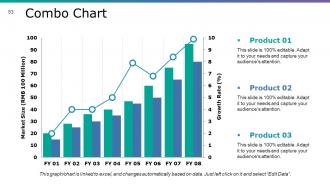
Slide 53 : Este é um slide de Gráfico de combinação para mostrar informações, especificações de comparação, etc.
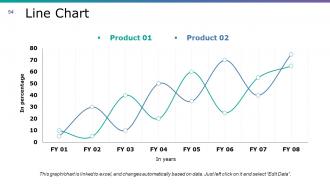
Slide 54 : Este slide apresenta um gráfico de linha para mostrar o crescimento do produto / empresa, comparação, etc.
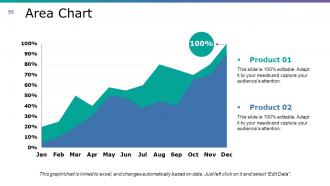
Slide 55 : Este slide apresenta um gráfico de área para mostrar o crescimento do produto / empresa, comparação, etc.
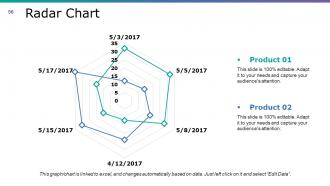
Slide 56 : Este é um slide do Gráfico de radar para mostrar o crescimento do produto / entidade, comparação, etc.
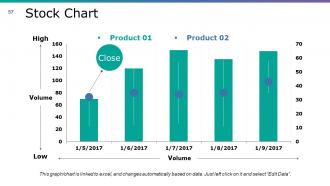
Slide 57 : Este é um gráfico de ações para mostrar o crescimento do produto / entidade, comparação etc.
Slide 58 : Este slide é intitulado Slides adicionais para avançar. Você pode alterar o conteúdo do slide conforme a necessidade.
Slide 59 : Este é o slide Nossa Missão. Missão da empresa estatal aqui.
Slide 60 : Este é um slide sobre nós. Estado equipe / especificações da empresa aqui.
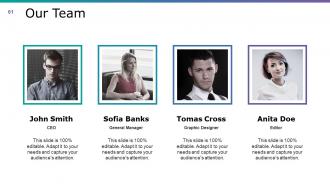
Slide 61 : Este é um slide da Nossa Equipe com nome e designação.
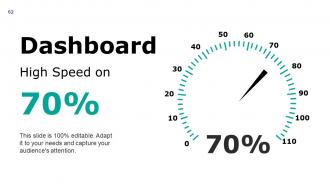
Slide 62 : Este slide exibe um painel com imagens métricas. Você pode apresentar kpis, métricas etc. aqui.
Slide 63 : Este é um slide Post It. Fixe seu texto aqui.
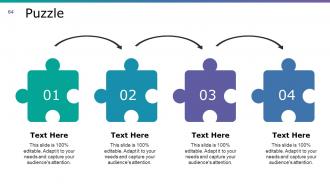
Slide 64 : Este é o slide Peças do Puzzle para mostrar informações, especificações, etc.
Slide 65 : Este é o slide da imagem de destino para mostrar informações, especificações, etc.
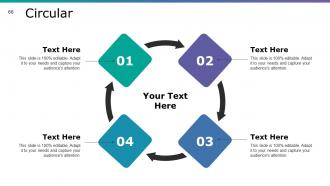
Slide 66 : Este é um slide de imagem circular para mostrar informações, especificações, etc.
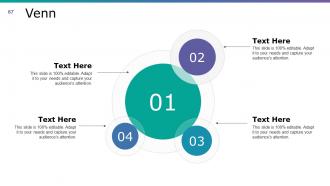
Slide 67 : Este é um slide de imagem do diagrama de Venn para mostrar informações, especificações, etc.
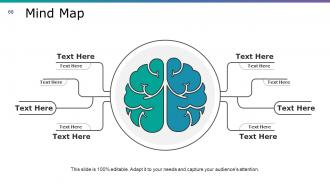
Slide 68 : Este slide mostra um mapa mental para representar entidades.
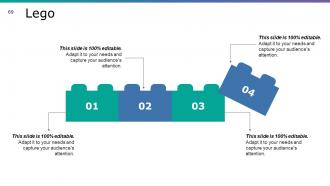
Slide 69 : Este é um slide de imagem de uma caixa de Lego para mostrar informações, especificações, etc.
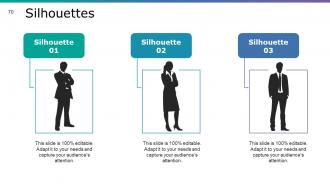
Slide 70 : Este é um slide de infográfico de silhuetas para mostrar informações, especificações etc.
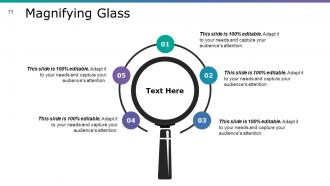
Slide 71 : Este é um slide de imagem de lupa para mostrar informações, especificações, etc.
Slide 72 : Este é um slide de agradecimento com endereço #, rua, cidade, estado, números de contato, endereço de e-mail.
Visão geral mensal dos negócios Slides de apresentação em PowerPoint com todos os 72 slides:
Combata as influências externas com nossos slides de apresentação em PowerPoint da Visão geral do negócio mensal. Certifique-se de que não afetam negativamente a sua empresa.









FAQs for Monthly Business Overview
So for your business overview, definitely include your mission, what you actually sell, and who you're selling to. Your competitive edge too - like what makes you different from everyone else doing similar stuff. Think of it as your elevator pitch but written down. Someone should get your company within like 30 seconds of reading. Throw in some company background, where you stand now, and future plans. Oh and don't skip the team stuff - people invest in people, you know? One page tops though. Nobody's reading a novel about your startup.
Your business overview really depends on what industry you're in. Tech companies obsess over innovation and how they'll scale up, but manufacturing? They care more about efficiency and supply chains. Finance and healthcare have to deal with all that regulatory stuff upfront - honestly such a pain but investors expect it. Retail focuses on customer experience, while B2B services talk up their client relationships. Short version: figure out what matters most to investors in your specific field and hit those points hard. Don't waste time on generic fluff that doesn't move the needle for your audience.
Honestly, good design makes or breaks these things. People zone out instantly if your slides look messy or boring. Stick to clean layouts and maybe 2-3 colors tops - trust me on this one. Charts beat paragraphs every single time for showing data. I've sat through way too many presentations that looked like someone just copy-pasted from Word. Pick a simple template and don't overthink it. The visuals should help tell your story, not compete with it. Also, consistent fonts matter more than you'd think.
Okay so basically you gotta figure out what each group actually cares about first. Investors? They want numbers - growth rates, ROI, that stuff. But customers just want to know you'll fix their problems. It's kinda like switching up your dating profile depending on the app, honestly. Make 2-3 different versions of your pitch. Lead with whatever matters most to that specific audience. So if you're talking to potential partners, open with your market position instead of burying it halfway through. Then test them out and see which ones actually work. Don't just guess what people want to hear - most of us are pretty bad at that.
Ugh, the worst thing you can do is dump every single detail on people - like seriously, nobody cares about your third-tier product features. Focus on the big picture: what problem you're solving and who you're helping. Don't be that person who just reads bullet points off slides (we've all sat through those snoozefests). Make it visual, practice your timing beforehand, and honestly? Always end with what you actually want from them. Oh, and skip the jargon - talk about your competitive edge in normal human words. People zone out fast if you sound like a manual.
Quarterly updates work as a baseline, but don't be rigid about it. New product launches? Market shifts? Competitive stuff happening? Update it right away. I've watched teams confuse the hell out of stakeholders because they were still using some ancient overview from like 8 months ago. Super awkward in meetings when nothing lines up. Set those calendar reminders every three months, then just stay flexible. Your overview needs to match what's actually happening now, not what you thought might happen back in January. Short version: schedule it quarterly, but update whenever reality changes.
Start with the basics - revenue, profit margins, and cash flow. Those three will tell you everything about whether your business is actually healthy. Growth rate matters a ton too, depending on where you are (monthly vs yearly). Oh, and if you've got customers coming back or paying subscriptions, track acquisition cost and lifetime value - seriously, investors eat that stuff up. Burn rate's obviously crucial if you're fundraising. But honestly? Don't go crazy with metrics. Pick like 4-5 that actually matter for your situation and know why each one's important.
Look, storytelling is everything for business overviews. Don't just list features - people's eyes glaze over. Instead, start with whatever problem made you think "screw this, I'm fixing it myself." Walk them through your journey, maybe mention a setback or two (makes you relatable). Stories stick in people's heads way better than boring bullet points anyway. Oh, and skip the corporate speak. Try something like "Last year we realized customers were getting totally screwed by..." rather than jumping straight into product benefits. End with your vision - where you're going next. Trust me, it'll feel way more human and actually get people interested.
Honestly, just grab Canva if you want something quick and clean - it's way more intuitive than people think. Grammarly's solid for catching typos and weird phrasing. I've been using ChatGPT lately to brainstorm when my brain's totally blank, which happens more than I'd like to admit lol. PowerPoint still works fine for presentations, or Prezi if you want to get fancy. Figma's cool too if other people need to jump in and edit. My take? Don't overthink it. Pick one design thing, one writing tool, then just dive in. You can always mess with it later once you see how it looks.
So online presentations need way more visuals and interaction since people zone out staring at screens. Break up text across more slides, throw in polls, pause for questions every few minutes. In-person is totally different though - you can actually read faces and go off-script. Honestly my best pitches happened when I scrapped half my slides halfway through and just talked. With online you need that structured engagement every 3-5 minutes or you'll lose them. In-person flows naturally. Oh, and make two versions of your deck because they're really that different.
Your business overview probably feels kinda empty right now because you're missing that competitive context. Pick 3-5 direct competitors and sprinkle those comparisons throughout instead of dumping them in one section. This helps you figure out what makes you different and where you actually fit in the market. Honestly, investors eat this stuff up - they want to see you understand the playing field. You'll spot gaps you're filling and get real about your strengths vs weak spots. Way more compelling than just describing what you do in isolation.
Dude, this stuff matters way more than people think. Japanese clients want to see your whole company hierarchy laid out formally - credentials first, then everything else. Germans? Hit them with hard data and technical details right away. Americans are all about that big vision energy and growth stories. Latin American markets care about your values and community ties before they'll even look at your numbers. You can't just slap a translation on your usual pitch and expect it to work. What kills it in New York might totally bomb in Seoul, so you gotta research each culture's communication style and flip your whole approach.
You definitely want your branding to stay consistent across all your business templates. Colors, fonts, logos - keep them matching everywhere. It builds trust and makes you look way more professional than if everything's all over the place. Honestly, inconsistent branding screams "amateur hour" to potential clients. When everything matches, people start recognizing your stuff instantly (kind of like how you'd spot a Starbucks from miles away). Just make a basic brand guide with your main elements and actually stick to it. I know it sounds boring, but it's one of those things that really pays off when you're consistent about it.
Honestly, charts and graphs are game-changers for business presentations. Nobody wants to sit through slides packed with text and numbers - your audience will zone out in like 30 seconds. When you show data visually, people actually get it right away. Trends jump out, comparisons become obvious, and you don't have to explain every little detail. It makes you look way more professional too. My old boss used to love cramming everything into bullet points, but visuals just hit different. Try swapping out three of your data-heavy bullet points for simple charts next time. You'll see the difference immediately.
Honestly, market positioning is like the backbone of your whole business story. You gotta nail that down first or everything else falls apart. Premium brand? Your overview should scream quality and exclusivity. Going budget-friendly? Focus on being accessible and good value. It's literally the lens people use to see your business - sounds cheesy but it's true. Without solid positioning, you end up with some bland, generic mess that nobody cares about. I learned this the hard way tbh. Figure out where you sit in the market, then let that drive how you tell your story.
-
I discovered this website through a google search, the services matched my needs perfectly and the pricing was very reasonable. I was thrilled with the product and the customer service. I will definitely use their slides again for my presentations and recommend them to other colleagues.
-
Wonderful templates design to use in business meetings.