Operational Performance Metrics Business Driver Decision Making Operational Intelligence Strategy Execution

Rating:
80%
Operational Performance Metrics Business Driver Decision Making Operational Intelligence Strategy Execution
Slide 1 of 11
Favourites Favourites

Try Before you Buy Download Free Sample Product

Audience Impress Your
Audience
Editable 100%
Editable
Time Save Hours
of Time
The Biggest Sale is ending soon in
0
0
:
0
0
:
0
0
Rating:
80%
This aptly crafted editable PPT deck contains eleven slides. Our topic specific Operational Performance Metrics Business Driver Decision Making Operational Intelligence Strategy Execution presentation deck helps devise the topic with a clear approach. We offer a wide range of custom made slides with all sorts of relevant charts and graphs, overviews, topics subtopics templates, and analysis templates. Speculate, discuss, design or demonstrate all the underlying aspects with zero difficulty. This deck also consists creative and professional looking slides of all sorts to achieve the target of a presentation effectively. You can present it individually or as a team working in any company organization.

Content of this Powerpoint Presentation


Slide 1: This slide introduces Operational Performance Metrics. State Your Company Name and begin.
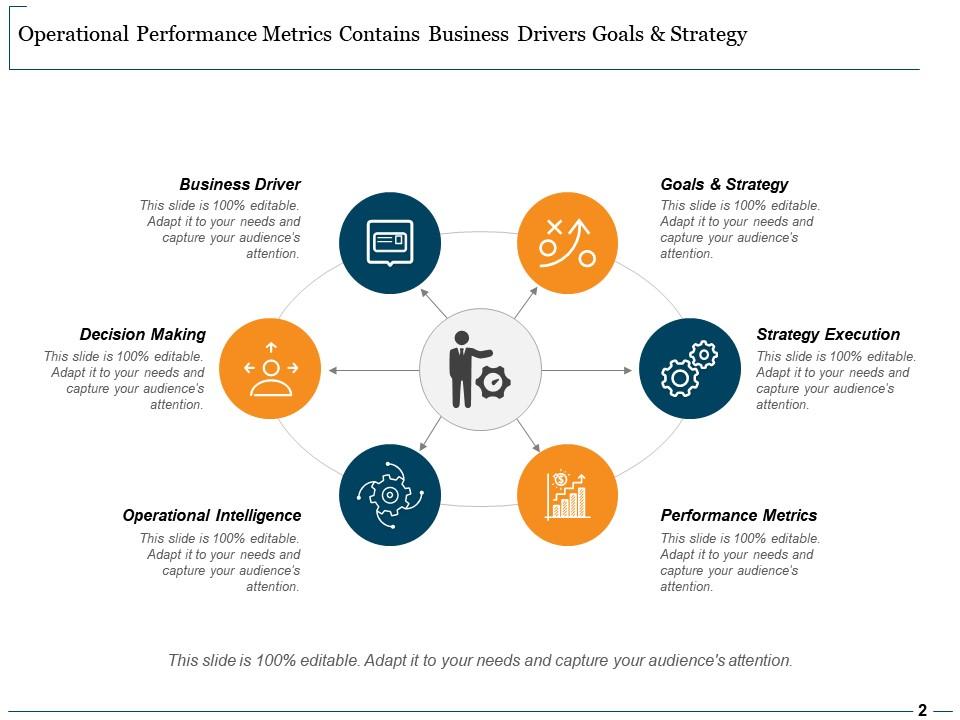
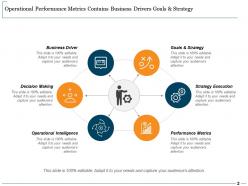
Slide 2: This slide shows Operational Performance Metrics Contains Business Drivers Goals & Strategy.
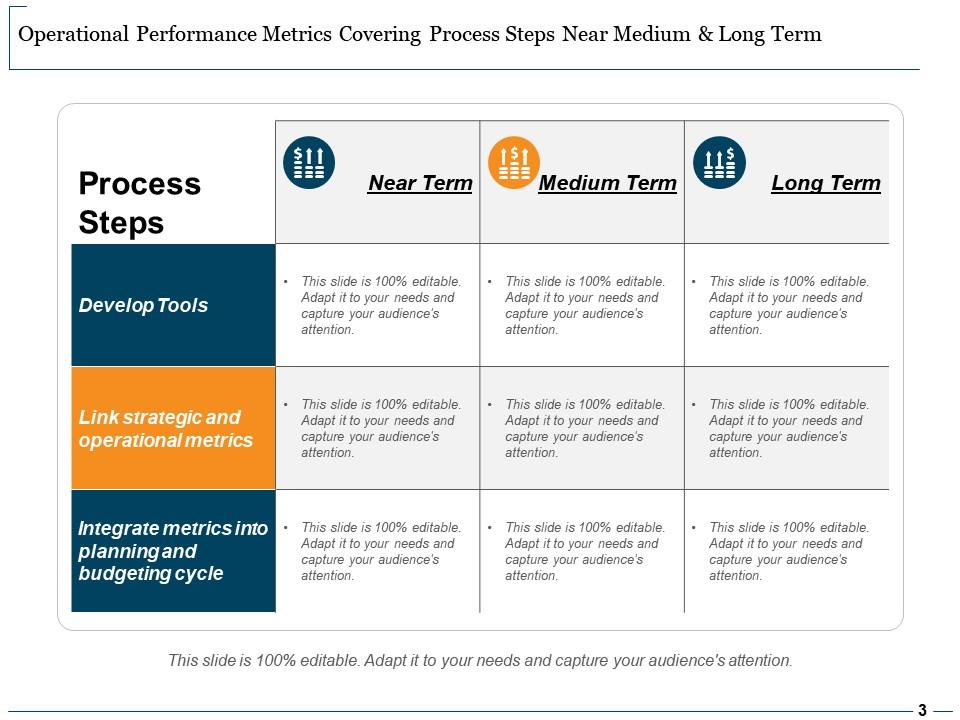
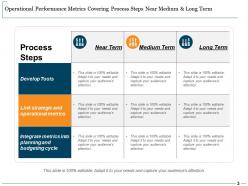
Slide 3: This slide presents Operational Performance Metrics Covering Process Steps Near Medium & Long Term.
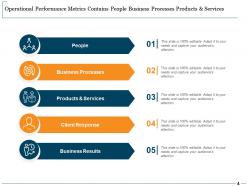
Slide 4: This slide displays Operational Performance Metrics Contains People Business Processes Products & Services.
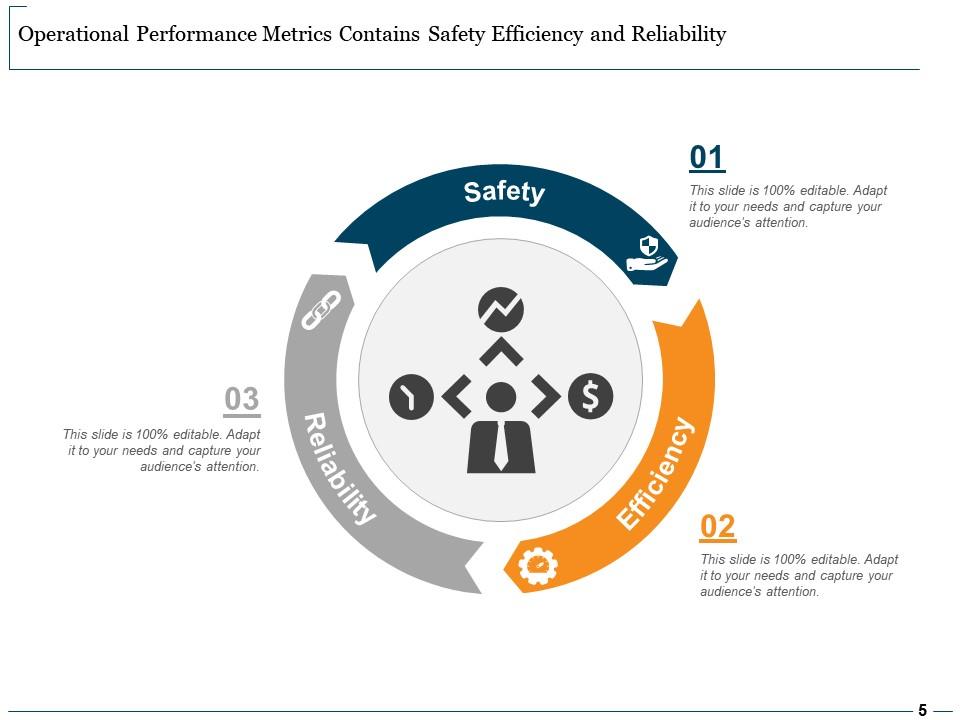
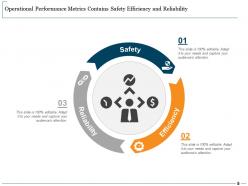
Slide 5: This slide represents Operational Performance Metrics Contains Safety Efficiency and Reliability.
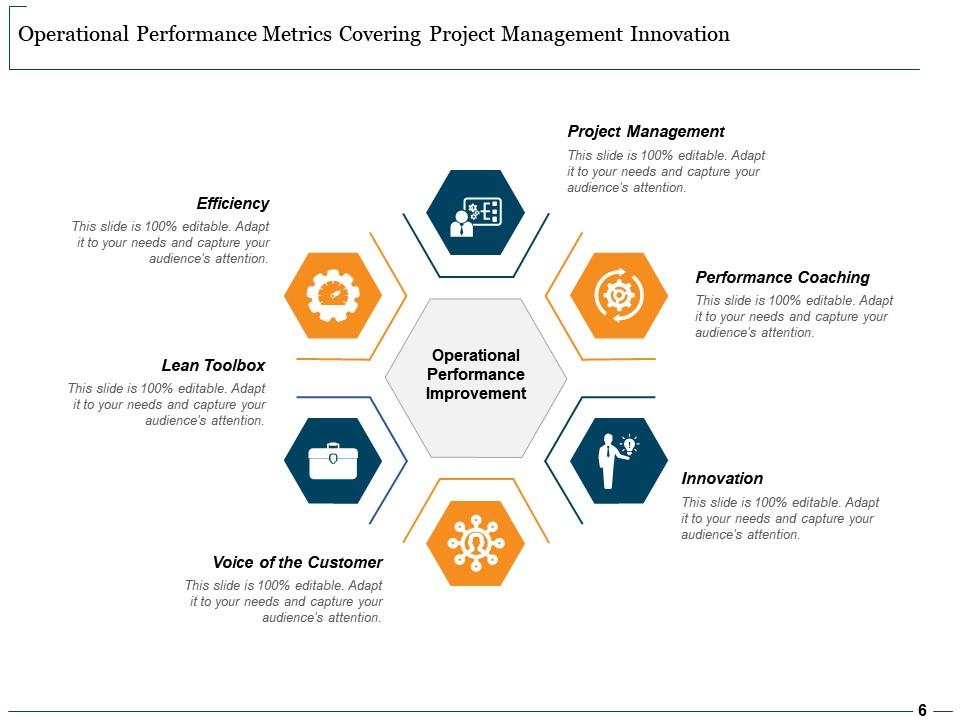
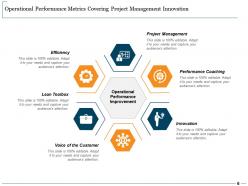
Slide 6: This slide showcases Operational Performance Metrics Covering Project Management Innovation.
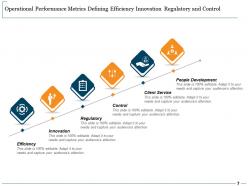
Slide 7: This slide shows Operational Performance Metrics Defining Efficiency Innovation Regulatory and Control.
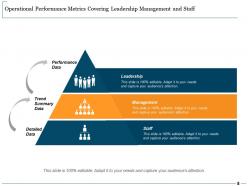
Slide 8: This slide presents Operational Performance Metrics Covering Leadership Management and Staff.
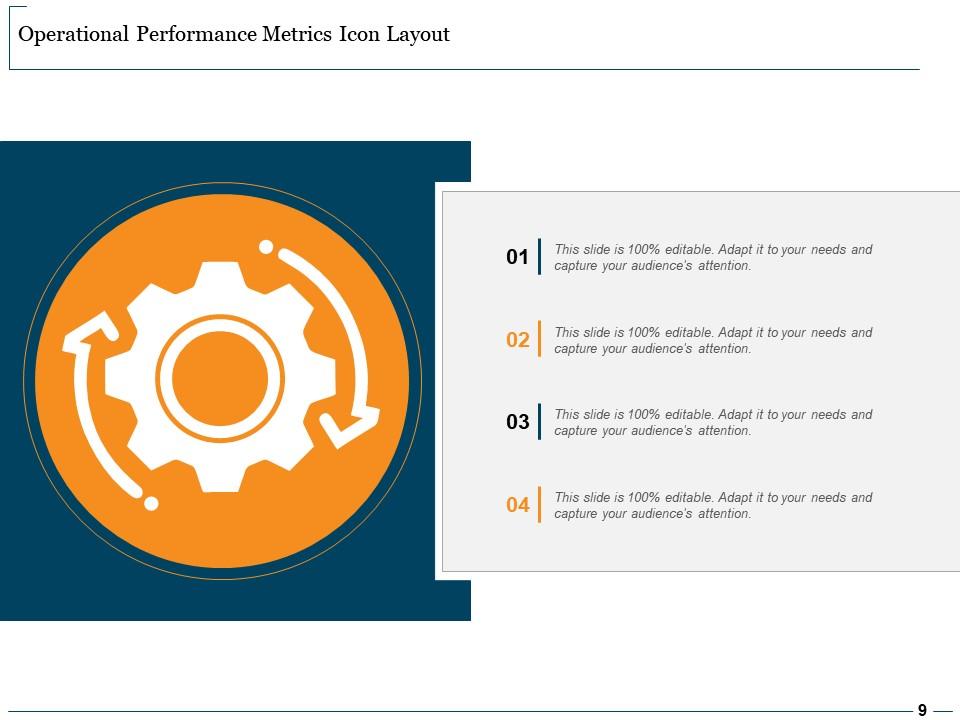
Slide 9: This slide displays Operational Performance Metrics Icon Layout with text boxes.
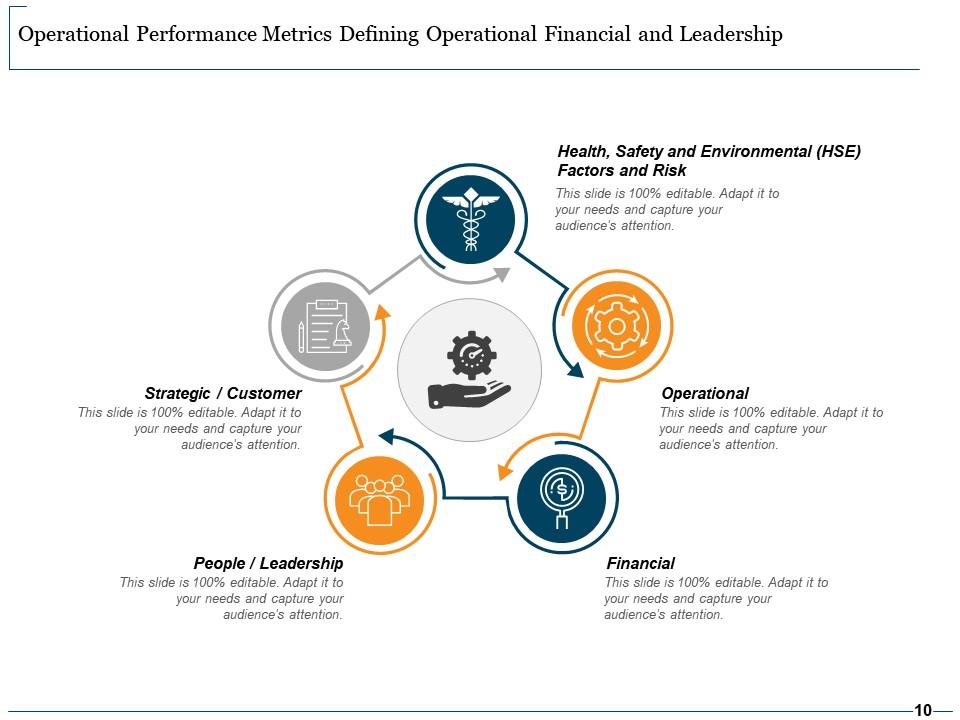
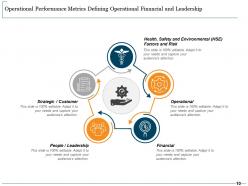
Slide 10: This slide represents Operational Performance Metrics Defining Operational Financial and Leadership.
Slide 11: This is a Thank You slide with address, contact numbers and email address.

FAQs for Operational Performance Metrics Business Driver Decision Making Operational

Honestly, start with OEE if you're not already - it rolls availability, performance, and quality into one number so you're not juggling a million different metrics. Cycle time and throughput are your other big ones. Downtime tracking is obvious but still critical (nobody's making money when machines are sitting there). I'd also watch scrap rates and labor productivity. Oh, and on-time delivery rates if you deal with customers breathing down your neck. Most teams I know had those "oh shit" moments once they actually started measuring OEE properly - you'll probably spot issues you didn't even know existed.

Honestly, just start with like 3-5 metrics that actually move the needle for your business. Don't try to track everything - I learned that the hard way! Tableau and Power BI are solid choices for dashboards, but custom stuff works too if you've got the dev resources. The real game-changer is setting up alerts when your KPIs hit certain numbers, so you're not glued to screens all day. Make sure your data sources are clean and updating regularly. Once you get those core metrics humming, then you can add more. Way easier than trying to boil the ocean from day one.

So metrics are like having a dashboard for your supply chain - you'll want to track stuff like delivery times, how fast inventory moves, and shipping costs. Pick the ones that actually matter to your biggest headaches, not just random data because it looks impressive. I swear, half the companies I've worked with collect tons of metrics but ignore the obvious red flags. Start with your worst pain points first. Things like lead times and on-time rates will give you that heads up before everything goes sideways. Don't overthink it - just focus on what helps you fix the stuff that's actually broken.

Track stuff like response times, resolution rates, and quality scores - that's where you'll spot the friction. Long wait times usually tank satisfaction scores, so fix those patterns before customers bail. Honestly, some companies I've worked with cut churn by 30% just from watching this stuff closely. Don't track metrics in a vacuum though. Connect your operational data to actual customer outcomes. Pick maybe 3-4 metrics that really hit customer experience and review them weekly with your team.

Honestly, less is more with these presentations. Traffic light dashboards work great - execs can scan green/yellow/red indicators super fast. I've sat through way too many meetings where someone throws 20 metrics on a slide and everyone just zones out. Stick to maybe 3-5 numbers that actually matter to the business. Always give context too, like "we hit 85% but our target was 90%." The trick is telling the story first, then backing it up with data. Don't just show charts and expect people to connect the dots themselves - they won't.

So basically, service businesses track totally different stuff than product companies. Services care about billable hours, how long clients stick around, project timelines - all that relationship-heavy stuff. Product companies? They're all about inventory turnover, how fast things sell, defect rates. Makes total sense though - you're either selling your brain or selling actual things people can touch. Honestly, I think most businesses mess this up by tracking vanity metrics. Just focus on whatever actually puts money in your bank account and you'll be fine.

Dude, it totally depends where you're at. Startups should obsess over customer acquisition cost, monthly recurring revenue, and burn rate - basically anything that shows you're growing or tells you how long before you're broke. Big companies? They care more about operational margins and efficiency stuff since they've already figured out the basics. I swear, half the startups I know get distracted by follower counts and website visits when they should be laser-focused on cash flow. Pick like 3-5 metrics max and actually pay attention to them. Don't try tracking everything - you'll just confuse yourself.

So basically, data analytics cleans up your messy numbers and finds patterns you'd never catch yourself. Real-time anomaly detection is huge - catches weird stuff as it happens instead of you finding out weeks later. Machine learning filters out all that noise and false alarms (honestly such a lifesaver). You can ditch the guesswork and basic averages for actual predictive models that show what's really going on. Automated dashboards beat those random periodic reports too. I'd start with whatever metrics are giving you the biggest headaches right now and add anomaly detection there first.

Honestly, you're gonna run into three main headaches. First is data silos - all your info is trapped in different systems that refuse to play nice together. Makes getting consistent numbers such a pain. Then there's metric overload because companies love tracking literally everything instead of what actually moves the needle. But the real killer? Getting teams on board. They'll smile and nod in meetings, then go right back to their old habits because change is hard. Oh, and they think it's just another layer of corporate BS half the time. My advice? Pick 3-5 metrics max that actually connect to real business results and start there.

So basically, you track stuff like how long things take, error rates, throughput - that kind of thing. The whole point is catching problems early before they blow up in your face. I think of it like a dashboard for your business health, you know? Pick maybe 3-4 metrics that actually matter to what your team does day-to-day (don't go overboard). Then you've gotta actually look at the data regularly and spot the patterns. When something's trending weird, that's your cue to dig deeper and figure out what's broken. Honestly, once you get in the rhythm of checking these numbers, it becomes second nature.

So here's the thing - those day-to-day numbers you track? They're basically showing you where your money's going. Customer acquisition costs, how fast inventory moves, employee productivity stuff. I didn't realize this at first, but once you start seeing the patterns, it's wild how much waste you can find. Like, inefficiencies just hiding everywhere eating your profits. Lower costs, better revenue, higher margins - it all adds up fast. Pick maybe 3-5 metrics that hit your biggest expenses or revenue spots. Don't overthink it, just start there and you'll see the connection pretty quickly.

Look, if your key numbers keep going south for months straight - like customer acquisition costs climbing or retention tanking - that's not just a bad quarter. Most teams (mine included, honestly) tend to ignore these red flags because admitting your strategy sucks is painful. But here's the thing: after 3+ months of multiple metrics heading downhill despite trying different tactics? Time to question whether your whole approach needs an overhaul. Maybe it's your target market, maybe your value prop just isn't resonating. Don't wait until you're scrambling in full panic mode.

Look, missing those benchmarks is gonna put you at a real disadvantage. Customers will start jumping ship to competitors who actually hit their numbers. Your costs go up, efficiency tanks - honestly, it's like trying to compete with one hand tied behind your back. Investors hate seeing companies underperform against industry standards too, so funding becomes way harder to get. Your team's morale probably takes a hit when they keep seeing other companies outpace you. I'd focus on figuring out exactly which metrics you're bombing and tackle those first.

Get everyone together (Zoom counts) and hash out what "winning" actually means for your shared stuff. Have each team bring their important numbers, then figure out where they overlap or depend on each other. Build one dashboard that shows metrics everyone gives a damn about - none of this silo nonsense. Monthly check-ins are non-negotiable though. Seriously, I've watched so many good projects crash and burn because teams just... stopped talking after week one. Pick someone to be the "numbers person" who keeps everyone honest and on track. Trust me on this.

Honestly, AI and ML are crushing it right now - they'll automate pattern recognition stuff that would take your team forever to do manually. Kafka and other real-time streaming platforms are pretty sweet too, you can actually watch metrics as they happen instead of waiting around for batch reports. IoT sensors are literally everywhere now (I swear they're putting them on coffee machines). Edge computing processes data closer to where it's collected, so less lag time. My advice? Look at what manual analysis tasks are eating up your time - that's where ML can give you the biggest wins first.

Ratings and Reviews

80% of 100
Review Form
Write a review
Most Relevant Reviews
  1. 80%

    by Douglas Lane

    Excellent work done on template design and graphics.

1 Item

per page: