The mark of successful business is how well is it faring compared to yesterday and how close you are inching to your performance objectives or financial objectives. In the absence of metrics and performance indicators, this pursuit will be tedious and aimless. Therefore, every business person aspiring to build a legacy must track their journey and constantly look for ways to improve. Operational metrics and KPIs act as the lighthouses in this journey. Some operational metrics that businesses must track are: Production rate, cycle time, inventory turnover, customer satisfaction score, etc.
An operational metric report, thus,prepared must be shared across departments or presented in conferences or company all-hand meetings. Based on this data, management can push their growth positive strategies or address bottlenecks.
To prepare your team for this, they need to be made aware of the parameters to be tracked. Using training modules, and well-prepared educational PPTs, employees can be guided on preparing valuable operational metrics reports.
SlideTeam understands this pain point of readying people to adopt performance metrics. We have used this knowledge to design and curate well-researched,PPT Templates to track and report progress. Download our content-ready templates to educate your staff and help them track and report operational metrics effectively. Scroll down to discover your ideal requirement.
Templates for You
Template 1: Operational Excellence Metrics PowerPoint Presentation
Discuss the operational performance metrics relevant to your business or department and present real-time statistics on these with the use of this PowerPoint presentation.Collect research-based data tracking operational metrics like reportable environmental incidents, capacity utilization rate, quality index, and order fulfillment cycle time using these PPT Slides. Track and present data on customer support tickets, and process downtime level to present in annual or bi-annual meetings. Download this presentation template now!
Template 2: Company Operational Performance Metrics Template
This PPT Presentation delivers on this objective of alloting purpose and utility to operational metrics being tracked. Discuss their utility in driving business goal and strategy, framing medium and long-term goals, and their impact on business processes, products, and services. Use graphics on pricing and diagrams of this operational metrics training presentation to enhance efficiency and reliability. Get this presentation template now!
Template 3: Operational Risk Management Key Metrics Dashboard
Use this PPT Presentation to ensure your preparedness in facing inevitable business threats and risks. Identify risks by number, financial impact, rating and frequency using characteristic graphs. Record risks by their identity, rating, and status by keeping tabs on them using this PowerPoint Dashboard. Grab now!
Template 4: Employee Operational Performance Metrics PPT Image
Your search for an employee operational performance metrics report template will end with this PPT Presentation. Create a general map of employees across departments and classify them on their performance. Using this matrix design, categorize them into nine divisions such as underperforming, core talent, new to rule, solid talent, misaligned talent etc. Infuse dynamism and creativity into your employee performance appraisal classification using this PPT Graphic. Get it now!
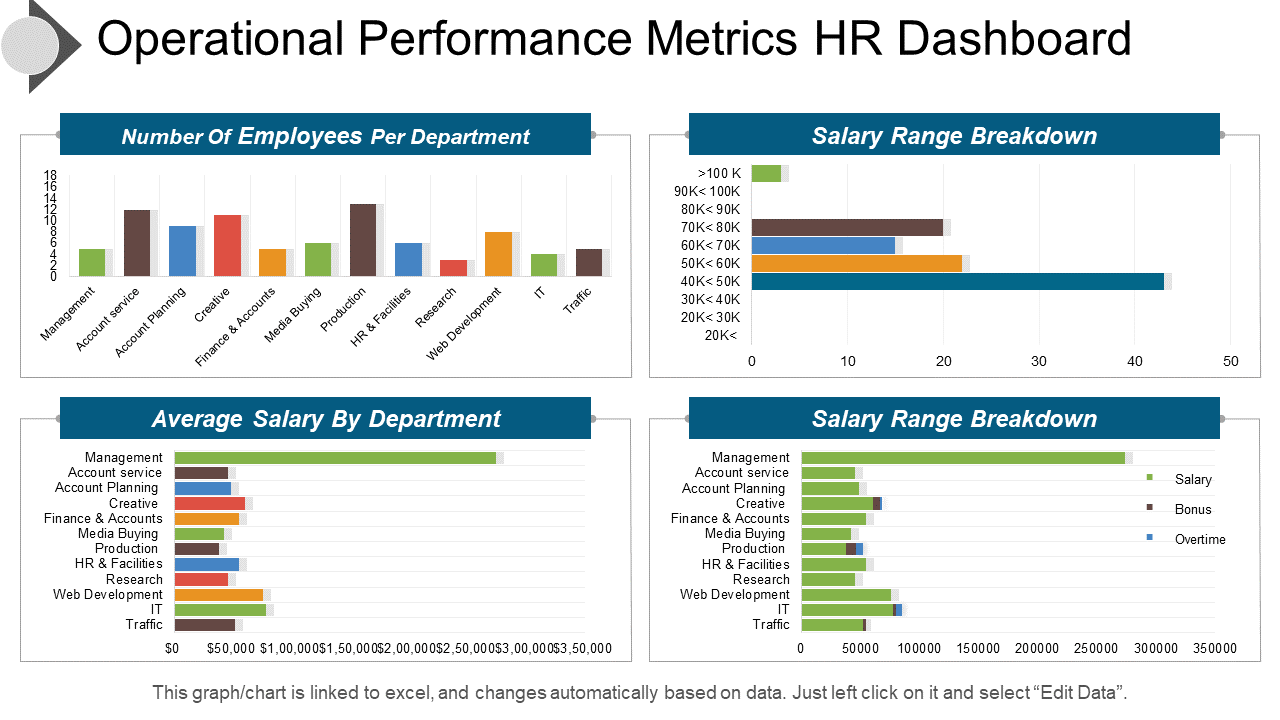
Template 5: Operational Performance Metrics HR Dashboard
Looking for an exclusive dashboard to track your HR operations? Look no further than this content-ready graphical template. Track employees and their salary distribution based on salary ranges, department, and inter-salary breakdown using this PPT Design. Cover diversity with color coding and use this slide to convey a lot of information on a single screen. Download now!
Template 6: Balance Scorecard Operational Performance Metrics PPT Icon
Showcase company and financial balances with this operational performance metrics scorecard. Track sales by month, gross revenue, and customer retention with this PowerPoint Slide. Maintain an executive scorecard to represent factors that contributed to the output such as measures taken in financial, customer, or learning domains. Download this creative PPT Layout right away!
Template 7: Operational Efficiency Performance Metrics PPT Templates
This PPT Layout helps you garner suggestions in determining the best operational metrics for your organization. This content-ready PPT Template hints at time metrics, throughput metrics, diagnosis metrics, complaint metrics, procedure metrics, etc. You can either side with these or add metrics based on your business analysis. Don’t wait, grab this editable PPT Layout now!
Template 8: Key Performance Metrics Pertaining to Business Operations
While jotting down operational metrics, address your primary business components namely people, business processes, products, and services. This presentation template is a reminder for you to take these factors into consideration and to devise operational metrics to track these. Use this as a pilot slide to develop correct, accurate and relevant metrics for measuring business performance. Download now!
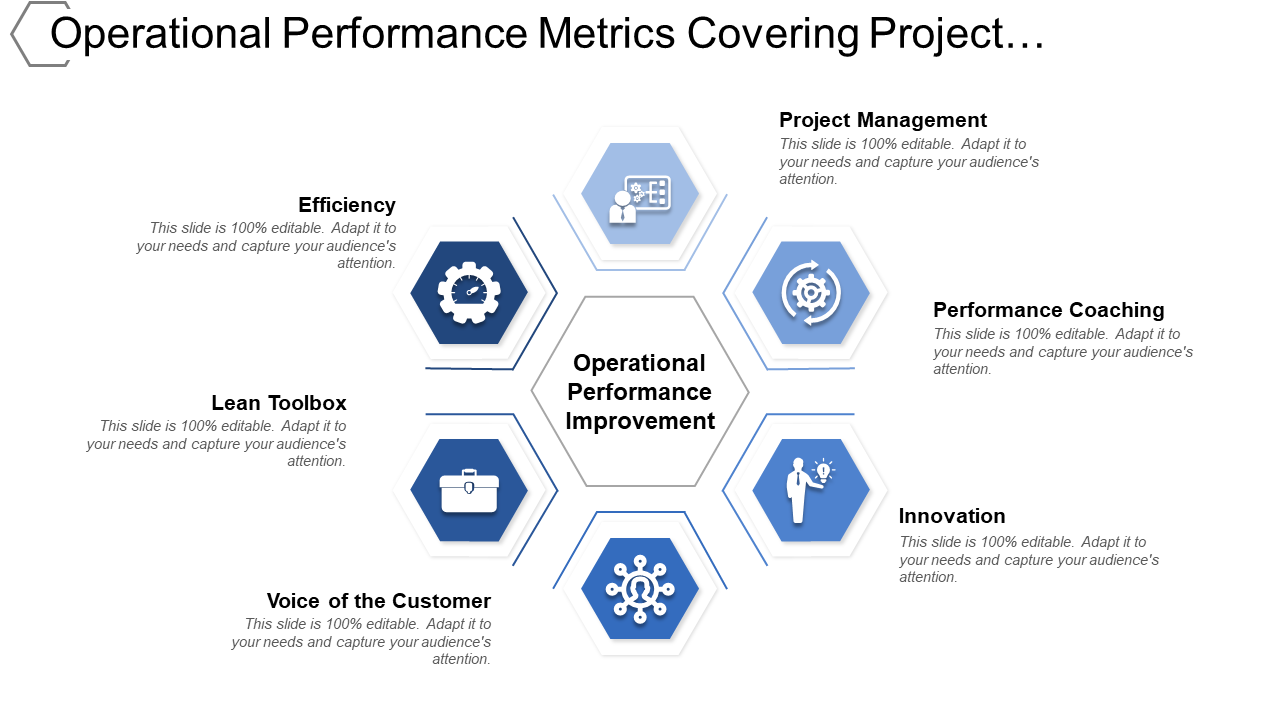
Template 9: Operational Performance Metrics Covering Project Management Innovation
For efficient project management, it is important to be aware of parameters that must be monitored and devise operational metrics to measure success accordingly. Use this PPT Graphic to point out these parameters such as voice of customer, efficiency, innovation, performance coaching etc that will deliver a successful project. Click on the link below to grab this purposeful PPT Slide.
Template 10: Operational Goals with Objective Reasons and KPI Metrics
Deploy this content-ready tabular slide to match operational metrics and KPIs with their established objective and associate reasons for addressing them. Use this presentation template to employ the correct metric for measuring success in terms of your well-defined and specific goals. This PPT Slide is ready to download. Get it now from the link below!
BRACE FOR CHANGE AND MEASURING RESULTS
Streamline your business activities and identify loopholes that pull you down by using correct operational metrics. Download these content-ready PPT Designs to monitor now!
PS: Risk identification and management is a crucial part of connecting seamless business operations everyday. Ensure your readiness with this toolkit, replete with risk management templates.
FAQs on Operational Metrics
What are four types of metrics?
The four types of metrics are:
- Outcome metrics: These metrics are used to evaluate the final result or outcome of a process or activity. For example, a business might use revenue or profit as an outcome metric to measure the success of its operations.
- Input metrics: These metrics measure the resources or inputs that are used in a process or activity. For example, a manufacturing company might track the amount of raw materials used in production as an input metric.
- Process metrics: These metrics measure the performance of a specific process or activity within a larger system. For example, a customer service department might track the average time it takes to resolve a customer complaint as a process metric.
- Output metrics: These metrics measure the outputs or deliverables of a process or activity. For example, a software development team might measure the number of lines of code written or the number of bugs fixed as output metrics.
What are operational vs financial metrics?
Operational metrics and financial metrics are two types of metrics used to evaluate business performance. Operational metrics are quantitative measures that track the performance of specific processes or activities within a business. They are used to evaluate the efficiency and effectiveness of operations and can help identify areas for improvement. Examples of operational metrics include:
- Production rate
- Cycle time
- Quality rate
- Customer satisfaction score
- Employee productivity
Financial metrics, on the other hand, measure a business's financial performance and are used to evaluate the profitability, liquidity, and overall financial health of a company. Examples of financial metrics include:
- Revenue Profit margin
- Return on investment (ROI)
- Cash flow Debt-to-equity ratio
While operational metrics are focused on tracking the performance of specific processes, financial metrics provide an overview of the business's financial performance as a whole. Both types of metrics are important for evaluating business performance and making informed decisions.
What is the difference between strategic and operational metrics?
Strategic and operational metrics are two metrics that businesses use to measure performance, but they serve different purposes.
Strategic metrics are used to track progress towards achieving long-term goals and objectives. They are high-level metrics that help to measure the success of the business strategy. Strategic metrics are used by senior management to make decisions related to the direction of the company. Examples of strategic metrics include market share, customer acquisition cost, and customer lifetime value.
Operational metrics track the performance of specific processes or activities within a business. They are lower-level metrics that help to measure the efficiency and effectiveness of day-to-day operations. Middle management and front-line employees use these metrics make decisions related to improving operational performance. Examples of operational metrics include production rate, cycle time, and customer satisfaction score.
State some operational metrics examples?
Here are some examples of operational metrics that businesses might use:
- Production rate: The number of units produced in a given time period.
- Cycle time: The time it takes to complete a process, from start to finish.
- Quality rate: The percentage of products or services that meet established quality standards.
- Customer satisfaction score: A measure of how satisfied customers are with the products or services they receive.
- Employee productivity: The amount of work completed by employees in a given time period.
- Inventory turnover: The number of times inventory is sold and replaced in a given time period.
- Website traffic: The number of visitors to a website in a given time period.
- Lead time: The time it takes to fulfill a customer order, from receipt to delivery.
- Customer retention rate: The percentage of customers who continue to do business with a company over time.
- Service level: A measure of how quickly customer service requests are resolved, typically expressed as a percentage of requests resolved within a certain time.


 Customer Reviews


![25+ One-Page Performance Reports for a Result Driven Assessment [Free PDF Attached]](https://www.slideteam.net/wp/wp-content/uploads/2022/03/1013x441no-button-18-1013x441.jpg)


