

Org chart business team with designation





Try Before you Buy Download Free Sample Product
 Impress Your
 Audience
 100%
100% Editable
 Save Hours
 of Time


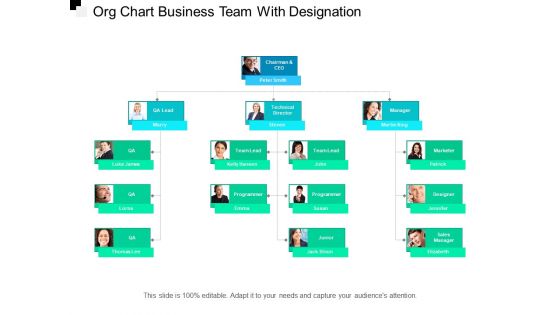
Don't worry about your experiences with displaying your team with their role play, our org chart business team with designation can take care of the most. The stages which can be utilized in this process are organization chart, project team structure and team representation with the designation. Our designers have included fifteen sections with employee image which can be personalized with your data, along with the space for name and designation of the employee. We have represented these stages in a family tree layout, starting from the ceo of the company, directing towards other key role players of the company. Just begin with all new experiences with our org chart business team with designation PPT deck. Our Org Chart Business Team With Designation are an astute gamble. Ample gains are a certainty.
People who downloaded this PowerPoint presentation also viewed the following :
Org chart business team with designation with all 6 slides:
Ensure growth of your business with our Org Chart Business Team With Designation. Give a boost to your cash flow.





FAQs for Org chart business
Organizational charts deliver enhanced communication flow, clearer role definition, improved accountability structures, streamlined decision-making processes, and better resource allocation across teams. These visual frameworks enable managers to identify skill gaps, optimize reporting relationships, and facilitate strategic planning, with many organizations finding that well-designed charts reduce operational confusion while accelerating team coordination and productivity.
Hierarchical structures create clear reporting lines and decision-making authority but can slow communication, while flat organizations enhance collaboration and agility though may lack role clarity. Matrix structures combine project flexibility with functional expertise, enabling cross-departmental innovation and resource optimization, with many organizations finding that hybrid approaches deliver enhanced adaptability and faster decision-making in increasingly complex business environments.
An org chart improves team communication by establishing clear reporting lines, defining decision-making authority, eliminating confusion about roles, and creating structured information flow pathways. Through visual hierarchy mapping, teams streamline collaboration, reduce miscommunication, and enhance accountability, with many organizations finding that well-defined structures ultimately deliver faster project execution and improved operational efficiency.
Visual representation in org charts enhances employee engagement by clearly defining reporting relationships, career progression paths, departmental connections, and decision-making hierarchies, reducing confusion about roles and responsibilities. Through interactive digital formats, organizations streamline communication flows, improve collaboration between teams, and boost employee satisfaction by providing transparency in organizational structure, with many companies finding that clear visual hierarchies ultimately deliver better role clarity and stronger workplace engagement.
Startup org charts should emphasize flexibility, flat structures, and cross-functional roles, while established companies require detailed hierarchies, specialized departments, and clear reporting lines. Startups benefit from minimal layers and adaptable positions that can evolve quickly, whereas mature organizations need comprehensive structures that support scalability, compliance requirements, and operational efficiency across multiple divisions, ultimately delivering clarity and strategic alignment for sustainable growth.
Org charts evolve through structural redesigns, new departmental additions, role redefinitions, reporting line adjustments, and hierarchical flattening or expansion as businesses scale. During strategic pivots, organizations frequently restructure teams around new priorities, create specialized divisions for emerging markets, and realign leadership responsibilities, ultimately enabling faster decision-making and enhanced operational efficiency.
Team members contribute to org chart accuracy by providing direct feedback on reporting relationships, role descriptions, departmental structures, and cross-functional collaborations that may not be visible to leadership. Through regular surveys, collaborative review sessions, and update requests, employees help identify gaps, outdated information, and evolving team dynamics, ultimately delivering more reliable organizational mapping and enhanced communication pathways.
Businesses face challenges including outdated information during rapid growth, inconsistent formatting across departments, unclear reporting relationships, and resistance to structural changes. These issues often result in confusion about roles and responsibilities, delayed decision-making processes, and miscommunication, with many organizations finding that regular updates and standardized templates significantly streamline operations and enhance organizational transparency.
Technology streamlines org chart creation and management through automated data integration, real-time updates, collaborative editing platforms, and visual design tools. Cloud-based solutions enable HR teams to sync employee information directly from databases, automatically reflect organizational changes, and provide interactive features for role exploration, ultimately delivering enhanced accuracy and significantly reduced administrative overhead.
Organizations should assess org chart effectiveness through span of control ratios, decision-making speed, communication flow efficiency, role clarity scores, and cross-functional collaboration metrics. These measurements help identify bottlenecks in reporting structures, redundant layers, and gaps in accountability, with many companies finding that streamlined hierarchies ultimately deliver faster project completion and improved employee satisfaction.
Cultural differences significantly influence organizational charts through varying hierarchical preferences, communication styles, decision-making approaches, and authority structures across regions. While Western organizations often favor flatter structures with direct reporting lines, many Asian and traditional cultures prefer clearly defined hierarchical levels, with companies like multinational banks adapting their regional org charts to reflect local cultural expectations while maintaining global operational efficiency.
Effective org charts should include dotted reporting lines for matrix relationships, cross-functional team indicators, shared service designations, project-based connections, and collaboration touchpoints between departments. These elements streamline communication by mapping informal networks, identifying key integration points, and highlighting resource-sharing opportunities, with many organizations finding that visual collaboration indicators reduce silos and enhance operational efficiency.
Org charts facilitate onboarding by providing new hires with clear visibility into reporting structures, team hierarchies, departmental connections, and key stakeholder relationships from day one. This visual framework enables faster integration, streamlines training workflows, and enhances role comprehension, with many organizations finding that structured organizational transparency significantly reduces onboarding time while improving new employee confidence and productivity.
Without a clear org chart, teams face confusion over roles and responsibilities, duplicated efforts, communication breakdowns, and unclear decision-making authority, ultimately reducing productivity and accountability. These structural gaps create inefficiencies in project management, delayed approvals, and frustrated employees who struggle to understand reporting lines, with many organizations finding that performance metrics decline significantly when hierarchical clarity is absent.
Feedback loops can be integrated through regular surveys, cross-departmental reviews, performance analytics, and structured input sessions from employees at all levels. This iterative approach enables organizations to identify communication gaps, optimize reporting structures, and enhance operational efficiency, with many companies finding that quarterly chart reviews and employee feedback significantly improve team alignment and organizational effectiveness.
No Reviews