


Performance analysis powerpoint presentation slides




Try Before you Buy Download Free Sample Product
 Impress Your
 Audience
 100%
100% Editable
 Save Hours
 of Time


Present your ideas and information, through our performance analysis PowerPoint presentation slides. The deck includes of a total of twenty-eight slides. You can personalize this presentation as per your branding needs. Various graphs are shown here to display detailed information. The concept of business performance indication is shown here. The presentation content includes all areas of Performance analysis and is extensively researched. This PowerPoint design is a one stage process and assists you to keep a track on your performance and can be used at recurring levels to evaluate your progress at reaching targets. Use this PPT deck in your business exhibition for an enduring experience and a steady connection. Download this template in a snap. Get your campaign afoot with our Performance Analysis Powerpoint Presentation Slides. Commence your endeavor with enthusiasm.
People who downloaded this PowerPoint presentation also viewed the following :
Content of this Powerpoint Presentation
Slide 1: This slide introduces PERFORMANCE Analysis. State Your Company Name and begin.
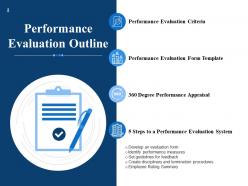
Slide 2: This slide shows Performance Evaluation Outline describing- Performance Evaluation Criteria, Performance Evaluation Form Template, 360 Degree Performance Appraisal, 5 Steps to a Performance Evaluation System, Develop an evaluation form, Identify performance measures, Set guidelines for feedback, Create disciplinary and termination procedures, Employee Rating Summary.
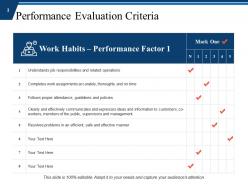
Slide 3: This slide presents Performance Evaluation Criteria in tabular form with related text.
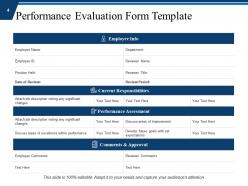
Slide 4: This slide displays Performance Evaluation Form Template describing- Employee info, Current responsibilities, performance assessment etc.
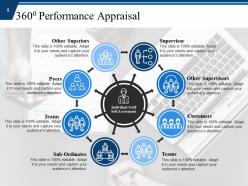
Slide 5: This slide represents 360 degree Performance Appraisal describing- Supervisor, Other Supervisors, Customers, Teams, Sub-Ordinates, Peers etc.
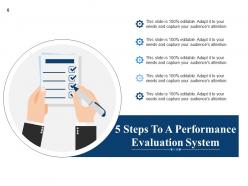
Slide 6: This slide showcases 5 Steps To A Performance Evaluation System describing- Develop an evaluation form, Identify performance measures, Set guidelines for feedback, Create disciplinary and termination procedures, Employee Rating Summary.
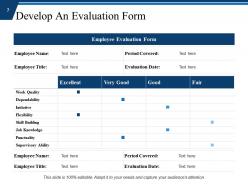
Slide 7: This slide shows Develop An Evaluation Form in tabular form with qualities as excellent, very good, good, fair etc.
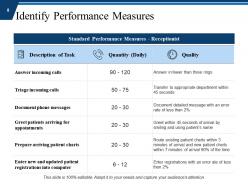
Slide 8: This slide presents Identify Performance Measures with categories as- Description of task, quantity and quality.
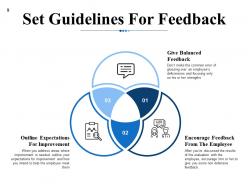
Slide 9: This slide displays Set Guidelines For Feedback as- Give Balanced Feedback, Encourage Feedback From The Employee, Outline Expectations For Improvement.
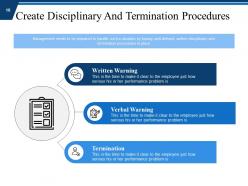
Slide 10: This slide represents Create Disciplinary And Termination Procedures with- Written Warning, Verbal Warning, Termination.
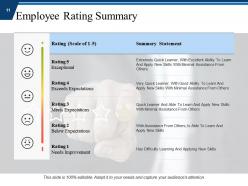
Slide 11: This slide showcases Employee Rating Summary with rating scale and summary statement.
Slide 12: This slide shows Performance Analysis Icons.
Slide 13: This slide is titled as Additional slide for moving forward.
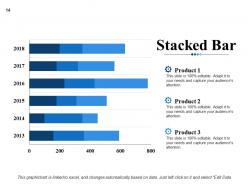
Slide 14: This slide shows Stacked Bar with three products comparison.
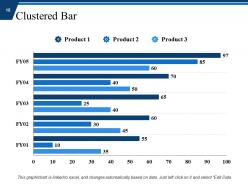
Slide 15: This slide displays Clustered Bar Chart with three products comparison.
Slide 16: This is Our Mission slide with related imagery and text.
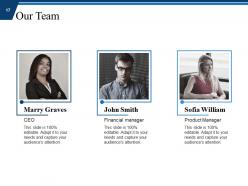
Slide 17: This is Our Team slide with names and designation.
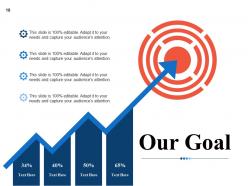
Slide 18: This is Our Goal slide. State your important goals here.
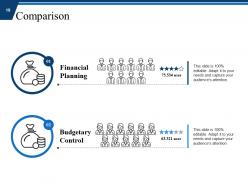
Slide 19: This is a Comparison slide with text boxes to show information.
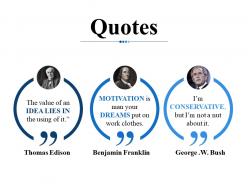
Slide 20: This is a Quotes slide to highlight or state anything specific.
Slide 21: This is a Financial slide. Show your finance related stuff here.
Slide 22: This is a Target slide. Show your targets here.
Slide 23: This is a Puzzle slide with text boxes.
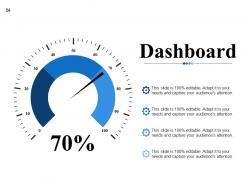
Slide 24: This slide shows Dashboard with text boxes to show information.
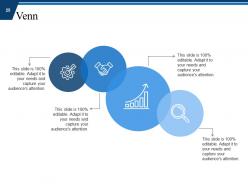
Slide 25: This is a Venn slide with additional text boxes.
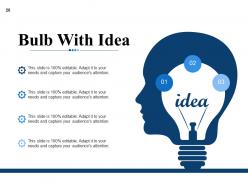
Slide 26: This is a Bulb Or Idea slide to state a new idea or highlight specifications, information etc.
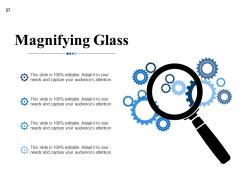
Slide 27: This slide displays Magnifying Glass with text boxes.
Slide 28: This is a Thank You slide with address, contact numbers and email address.
Performance analysis powerpoint presentation slides with all 28 slides:
Arrive at the apex with our Performance Analysis Powerpoint Presentation Slides. The entire ascent will be exciting and enjoyable.

FAQs for Performance analysis
Focus on the basics first - revenue, profit margins, ROI. Then add industry stuff like customer acquisition cost if you're SaaS or inventory turnover for retail. Honestly, half the dashboards I see are just pretty numbers that don't actually help you make decisions. Pick maybe 5-7 metrics max that connect to your real goals. I'd start by figuring out what success actually looks like for your business, then find the numbers that tell you if you're getting there. Don't fall into the trap of tracking things just because they're easy to measure.
Honestly, just set up automated pipelines that dump data straight into whatever dashboards you're already using. Most tools have APIs for Tableau, PowerBI, spreadsheets - the usual suspects. Configure scheduled reports so insights get sent to your team automatically. Trust me, nobody wants to pull data manually every week (learned that the hard way). Start with the metrics your stakeholders actually care about - not everything under the sun. Get those flows running first. Once that's solid, you can get fancy with more complex stuff. Oh, and make sure the reports land in people's inboxes at a time they'll actually read them.
Charts and graphs are honestly a game-changer for performance presentations. Nobody wants to sit through endless spreadsheets - your audience will zone out in like 30 seconds. Visual data tells the story way better and people actually remember it. Just pick the right type though. Bar charts work great for comparisons, line graphs show trends over time, heat maps reveal patterns you'd totally miss otherwise. Oh and always start with your main point first, then use the visual to prove it. Simple beats fancy every time. Trust me, I've sat through way too many data-heavy meetings that could've been emails.
Look, performance analysis basically stops you from making decisions based on hunches that are probably wrong. You'll actually see what's working vs what you *think* is working - and honestly, the gap can be pretty shocking. It helps you figure out where to spend your time and money for the biggest payoff. Way better than just throwing stuff at the wall and hoping something sticks. Focus on your most important metrics first, then build from there. When the data shows something isn't working, don't be stubborn about it - just pivot and move on.
Honestly, the worst thing you can do is jump straight into fixing stuff without actually understanding what's broken. I see people do this all the time - they get excited about solutions before they even know the real problem. Also, don't get caught up in metrics that look impressive but don't actually matter for the business. Performance issues are usually connected to each other, so you've gotta look at everything together, not just one piece. Oh, and set baselines first! Otherwise you'll never know if your changes worked. Whenever you find something weird, ask yourself "so what?" - if it doesn't impact users or business goals, you're probably wasting time.
Honestly, benchmarking is like getting a wake-up call about where you actually are vs. where you think you are. You'll spot the real gaps in your performance instead of just guessing. Leadership loves it too - saying "our competitors are 15% better at this" gets way more traction than throwing out random suggestions. The trick is finding benchmarks that actually match your industry and size (don't compare yourself to Amazon if you're a startup, you know?). Once you see those gaps, prioritize the fixes that'll give you the biggest edge first.
Numbers don't tell the whole story - you've gotta dig into what's actually happening behind them. Team morale matters. So does customer feedback, market shifts, any big organizational changes. I've watched too many analyses crash and burn because people ignored the "why" part. Think about stuff like budget constraints, seasonal trends, competition breathing down your neck. Internal process changes can mess with your metrics too (learned that one the hard way). Employee surveys and user feedback? Pure gold. Bottom line: ask yourself what context your raw data is missing.
Real-time analytics completely changes how you handle performance stuff - no more waiting around for monthly reports that are already outdated. You can actually see what's happening right now and fix problems before they get worse. Honestly, those quarterly reviews are the worst because they feel so disconnected from day-to-day reality. With live data, your team can pivot strategies on the spot based on what's actually working. Plus you'll spot your top performers immediately and figure out what they're doing differently. My advice? Pick one metric you usually check monthly and try getting daily updates on it instead. See how much more responsive you become.
Honestly, I'd start with regression analysis - that's gonna be your go-to for figuring out what's actually driving performance changes. Correlation matrices are super helpful too for spotting connections between different variables. Time series stuff is key if you're tracking things over time (which you probably are). Oh, and don't sleep on control charts - they're weirdly good for monitoring ongoing performance even though they seem boring. Hypothesis testing helps you figure out if changes are real or just random noise. I'd focus on regression and correlation first though, since they'll give you the clearest picture of what factors are worth digging into.
Honestly, treat user feedback like another KPI - it's data you can actually track. Set up sentiment analysis on reviews, support tickets, NPS stuff to spot trends. Feedback dashboards are clutch because nobody can pretend customers aren't complaining anymore lol. When your performance metrics tank, dig into what users were saying around that time - there's usually a connection. The tricky part is figuring out how much weight to give qualitative feedback vs your hard numbers. I'd start by seeing which complaint themes match up with existing bottlenecks you already know about.
Honestly, culture is everything when it comes to performance analysis. In toxic, blame-heavy environments? People just game the system or straight-up hide issues. Your data becomes garbage. But psychological safety changes the whole game - suddenly teams actually want to dig into the numbers and improve. I've watched identical frameworks crush it with one team while completely bombing with another (same company too, which was wild). Trust has to come first. Otherwise you're basically building pretty dashboards that collect digital dust while everyone ignores the insights.
Here's what I've found works: track your key metrics for a few weeks first. Performance analysis shows you the real gaps between what your team's doing and what they should be doing. Way better than just guessing from random complaints, honestly. You'll start seeing patterns - maybe everyone's hitting the same roadblock in your process, or certain skills keep coming up missing across different projects. Individual issues become obvious, but you'll also catch team-wide problems you totally missed before. Then just match those specific gaps to training programs. Pretty straightforward once you have the data.
Honestly, New Relic and Datadog are your best bets for APM - they're what everyone uses for good reason. Splunk's amazing if you're drowning in log data. For infrastructure stuff, I'd go with Prometheus + Grafana since it's free and the dashboards look sick. Database performance? SolarWinds or Quest Foglight work well, though they're pricier. Actually, step back first - figure out what you're trying to track. Response times? Server load? User experience? That'll help you avoid buying something you don't need. Start there, then match the tool to your actual problems.
Look, tracking your metrics consistently is like having a heads-up before everything goes sideways. You'll catch patterns - maybe efficiency dropping or budgets creeping up - way before they become actual disasters. Honestly, most people just cross their fingers and hope nothing breaks. Instead, figure out which numbers usually tank right before your worst problems hit. Those become your warning signs to watch like a hawk. Then you can actually do something about specific risks instead of scrambling when it's too late. Way better than playing defense all the time.
Honestly, the ML stuff is getting crazy good at catching performance issues before they blow up. Three things to focus on: predictive analytics, real-time monitoring, and self-service dashboards for employees. Companies are ditching annual reviews for continuous feedback too - which makes way more sense if you ask me. Team metrics are becoming bigger than individual ones. Oh, and don't go overboard right away. Start with basic real-time tools first, then build up your analytics game from there. You'll save yourself a headache that way.
No Reviews