


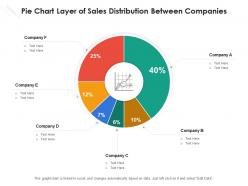
Pie chart layer of sales distribution between companies





Try Before you Buy Download Free Sample Product
 Impress Your
 Audience
 100%
100% Editable
 Save Hours
 of Time


Our Pie Chart Layer Of Sales Distribution Between Companies are topically designed to provide an attractive backdrop to any subject. Use them to look like a presentation pro.
People who downloaded this PowerPoint presentation also viewed the following :
Pie chart layer of sales distribution between companies with all 2 slides:
Use our Pie Chart Layer Of Sales Distribution Between Companies to effectively help you save your valuable time. They are readymade to fit into any presentation structure.
FAQs for Pie chart layer of sales
Look at revenue per channel first - that's your bread and butter right there. Conversion rates matter too, plus customer acquisition costs for each channel. I'd also track what percentage of your target market each channel actually reaches. Geographic market share is huge if you're trying to expand into new areas. Channel conflict stuff can get messy - nobody wants distributors stepping on each other's toes. Honestly, I'd map this out every quarter and then dig into whatever's not performing or doing weird things you didn't expect.
Location totally changes your sales game. I'd start by pulling your data by zip code or state first - you'll spot the obvious stuff right away. Urban areas usually mean higher volume but rural customers might actually be more profitable. Shipping costs can kill you though (trust me on this one). Income levels and population density make a huge difference too. Oh, and seasonal trends hit completely different depending on the region - like what crushes it in New England might bomb in Arizona. Climate's weirdly important for some products. Break it down geographically before you dig into anything else.
Honestly, customer segmentation is like having a roadmap for your sales strategy. Without it, you're basically throwing darts blindfolded. Different customers want different things - enterprise clients expect that white-glove treatment with dedicated reps, but smaller businesses? They'd rather just buy online and be done with it. Geography matters too. Map out who you're selling to based on size, behavior, location, whatever makes sense for your business. Then match your distribution channels accordingly. I've seen companies waste tons of resources trying to sell the same way to everyone. Don't be that guy. Look at your current segments and see where you're missing the mark.
Honestly, tech makes such a huge difference for sales accuracy. CRM systems let you see real-time numbers across every channel - no more guessing. Analytics catch patterns you'd totally miss otherwise, and those BI dashboards? They're actually pretty amazing for visualizing everything at once. Machine learning can predict trends and flag weak territories automatically, which is wild. The integration part is key though - it pulls data from everywhere so you're not juggling random spreadsheets. I'd start by just connecting what you already have. That alone will make things way more accurate.
Okay so first thing - don't just stare at your total sales numbers like they mean everything. Break that stuff down by channel, region, product, whatever makes sense. You'll actually see where the opportunities are hiding. Also, context matters way more than people think. Like, are you factoring in seasonality? Market shifts? I've seen so many teams ignore this and then act shocked when their "insights" fall apart later. Oh and make sure you're comparing similar time periods - sounds obvious but trust me. Before you do anything though, check if your data's even clean. No point analyzing garbage, right?
So basically, sales distribution analysis shows you which products sell consistently vs the unpredictable ones. Super helpful for inventory planning! Keep steady stock for your reliable performers. The volatile products? Order smaller amounts more often - trust me, getting stuck with dead inventory sucks. You'll also spot seasonal patterns and which regions buy what. Honestly, just plot your top 20 products' sales over the past year and the patterns jump right out. Game changer for knowing what to stock where.
Honestly, it's all about volume vs complexity. B2C means you're crunching thousands of tiny transactions - geographic patterns, seasonal stuff, channel performance. Way different beast than B2B. With B2B you've got fewer deals but they're massive, and one account can totally mess up your whole analysis. Focus on account-level breakdowns, where deals sit in the pipeline, territory performance. The sales cycles drag on forever too (ugh), plus you're dealing with like 5 decision makers per deal. So tracking touchpoints gets messy fast. Bottom line: segment your approach based on transaction volume and how deep those customer relationships run.
Honestly? Monthly is the sweet spot, but quarterly works if that's all you can handle. Most teams I know go quarterly and do fine. Daily stuff is just noise - you need enough data to actually see patterns. Here's the thing though - I've watched companies get all excited about weekly reports and it becomes this huge time suck that nobody reads. Consistency beats frequency every time. Pick whatever schedule won't make you want to quit, then actually use what you find to tweak territories or shift resources around. Way better to nail quarterly reviews than pump out crappy monthly ones nobody acts on.
Seasonal trends totally mess with your sales distribution - demand gets crazy concentrated during holidays, weather changes, stuff like that. Black Friday might blow up your online sales while physical stores stay dead. Summer products? They all shift to vacation spots. Your "normal" distribution becomes meaningless during these periods. The tricky part is some channels get slammed while others sit empty, which honestly creates a nightmare for inventory planning. I'd dig into 2-3 years of data to spot these patterns. Then you can actually plan your distribution around the seasonal chaos instead of getting blindsided every time.
So for sales distribution stuff, I'd go with Tableau or Power BI first - they make spotting patterns way easier. Excel's fine if money's tight, but honestly it gets annoying with big datasets. If you're already using Salesforce, their analytics thing is pretty decent. Google Analytics covers your online channels. Got someone techy? Python with pandas works great. Power BI's probably your best bet though - plays nice with most CRMs and won't cost a fortune. Oh, and don't try learning three tools at once. Pick one and actually get good at it.
Look, historical data is like having a cheat sheet for your sales strategy. Pull your last 2-3 years and map it against different channels - you'll see which regions actually perform versus the ones you've been babying for no reason. Seasonal patterns jump out pretty quickly too. Most people just wing it and then act shocked when numbers are all over the place. The data shows real customer behavior, not what you hope they'll do. I spent way too much time guessing at this stuff early on. Start there and you'll probably spot some obvious wins within an hour of digging in.
Economic shifts mess with your sales channels more than you'd think. When times get tough, customers flock to cheaper products and discount stores. Growth periods? Premium stuff starts flying off the shelves. Interest rates hit big purchases hard, and inflation affects different regions weirdly - some places just get crushed while others barely notice. Supply chain chaos makes people try new stores or brands they never would've touched before. Track economic indicators with your sales data so you can pivot channels before things tank. Honestly, catching these patterns early is half the battle.
Your competitors basically force you to scramble and rethink where you're selling stuff. When they flood a region or steal your best distributors, you're kinda screwed if you don't pivot fast. They'll undercut prices in certain channels or grab the good retail spots first. Honestly feels like whack-a-mole sometimes. You gotta watch what they're doing because it totally changes where your money's coming from - both location-wise and which sales channels actually work. Check their distribution moves every month so you can shift your territory focus before they eat your lunch.
Dude, you really need multiple sales channels - trust me on this one. If your main channel crashes, you're totally fucked without backup options. Different people buy differently too. Some folks are die-hard online shoppers, others still want that in-person experience, and plenty go through resellers or whatever. Having variety protects your revenue when markets get weird (which they always do). Look at what channels you're using now and find 2-3 spots where you could reach new customers. It's like not putting all your eggs in one basket, except way more profitable.
Basically, you want to see where your money's actually coming from. Map out your top revenue sources first - like which channels or regions are killing it vs the ones that suck. I'd look for weird patterns too, maybe your email game is strong in certain areas but totally bombs elsewhere. That tells you where to throw more budget and what to either fix or just drop entirely. Short sentences work here. You'll probably find gaps where competitors aren't doing much either. The whole point is figuring out the "why" behind what's working so you can do more of it.
-
Professional and unique presentations.
-
Innovative and attractive designs.