
Problem Analysis Model PowerPoint Presentation Slides


Try Before you Buy Download Free Sample Product
 Impress Your
 Audience
Editable
of Time


Our Problem Analysis Model PowerPoint Presentation Slides are topically designed to provide an attractive backdrop to any subject. Use them to look like a presentation pro.
People who downloaded this PowerPoint presentation also viewed the following :
Content of this Powerpoint Presentation
Slide 1: This slide introduces PROBLEM Analysis Model. State your Company Name and begin.
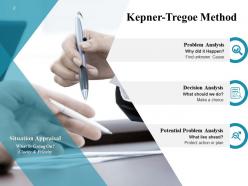
Slide 2: This slide shows Kepner-Tregoe Method for problem analysis describing- Problem Analysis, Decision Analysis, Potential Problem Analysis.
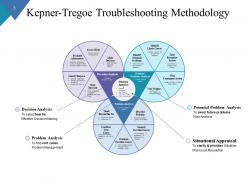
Slide 3: This slide presents Kepner-Tregoe Troubleshooting Methodology with- Potential Problem Analysis, Situational Appraisal, Decision Analysis, Problem Analysis.
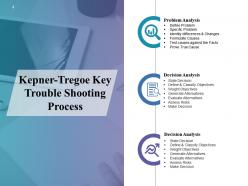
Slide 4: This slide displays Kepner-Tregoe Key Trouble Shooting Process describing- Problem Analysis, decision analysis etc.
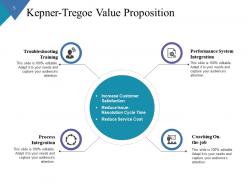
Slide 5: This slide represents Kepner-Tregoe Value Proposition describing- Troubleshooting Training, Process Integration, Performance System Integration, Coaching On-the-job.
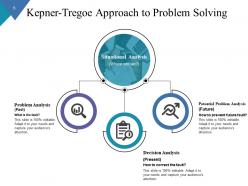
Slide 6: This slide showcases Kepner-Tregoe Approach To Problem Solving describing- Problem Analysis, Potential Problem Analysis, Decision Analysis.
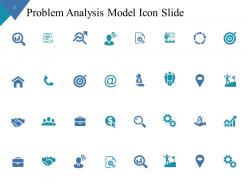
Slide 7: This slide shows Problem Analysis Model Icons.
Slide 8: This slide is titled as Additional Slides for moving forward.
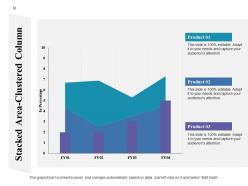
Slide 9: This slide shows Stacked Area-Clustered Column chart with three products comparison.
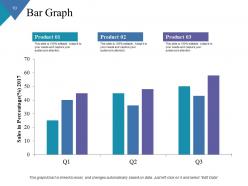
Slide 10: This slide displays Bar Graph with three products comparison.
Slide 11: This is Our Mission slide with related imagery and text boxes.
Slide 12: This is Our Team slide with names and designation.
Slide 13: This is About Us slide to state company specifications etc.
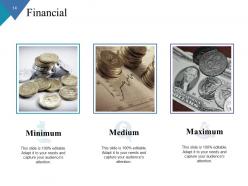
Slide 14: This is a Financial slide. Show finance related stuff here.
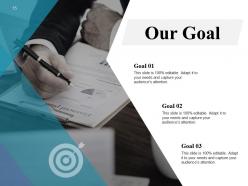
Slide 15: This is Our Goal slide. Show your goals here.
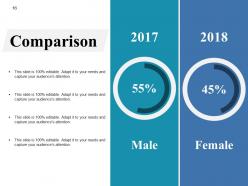
Slide 16: This is a Comparison slide to state comparison between commodities, entities etc.
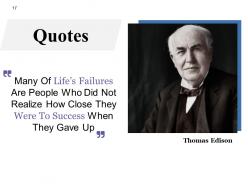
Slide 17: This is a Quotes slide to highlight or state anything specific.
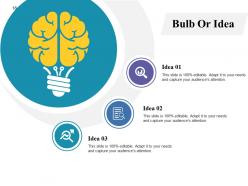
Slide 18: This is Bulb Or Idea slide to state new idea or highlight specifications, information etc.
Slide 19: This slide shows Mind Map for representing entities.
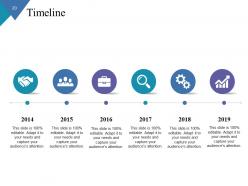
Slide 20: This is a Timeline slide. Show information related with time period here.
Slide 21: This is a Thank You slide with address, contact numbers and email address.
Problem Analysis Model PowerPoint Presentation Slides with all 21 slides:
Use our Problem Analysis Model PowerPoint Presentation Slides to effectively help you save your valuable time. They are readymade to fit into any presentation structure.


FAQs for Problem Analysis Model
You need five things for a decent problem analysis: define what's actually broken, dig into root causes, see who gets hurt by it, spot your constraints, and set up how you'll judge solutions. Most people totally skip the first step though - they rush straight to fixing stuff without even knowing what the real problem is. Write out a one-sentence problem statement before doing anything else, trust me on this. Then map out who's affected, figure out what's holding you back (money, time, whatever), and decide what success looks like. It's boring prep work but it'll save you hours of spinning your wheels later.
Dude, so the problem analysis thing is actually genius because it stops you from doing what everyone does - jumping straight to fixing stuff without knowing what's broken. Most teams are terrible at this, honestly. You break down what's happening now vs what you want, find the real causes (not just surface issues), and map out everything that's contributing. Think of it like debugging but for business mess. When you actually follow the steps, your decisions hit way harder because you're fixing the right thing. Sounds boring but it works - definitely try mapping your situation out first.
Honestly, start with the "5 Whys" method - just keep asking "why" until you hit the real problem. Sometimes takes way more than 5 questions though, don't let the name fool you. Fishbone diagrams are solid too if you want something more visual. They map out contributing factors across different categories like people, process, tech, environment. For system stuff, failure mode analysis works well but that's probably overkill for most situations. The trick isn't having fancy techniques - it's actually sticking with one method instead of bouncing around. Most people give up too early and only fix surface-level symptoms.
Dude, you absolutely need those stakeholders involved from day one. They're the ones actually dealing with this mess daily, so they'll spot things you'd completely miss. Multiple viewpoints = way better analysis. Here's the thing though - people get weirdly cooperative when they feel like you actually listened to them first. Skip their input and you're basically just throwing darts blindfolded at what might be the real problem. I learned this the hard way on a project last year. Map out who matters most, then build your whole analysis around getting their honest take. Trust me on this one.
Healthcare and manufacturing see the biggest wins from problem analysis models. Hospitals catch medical errors before they hurt patients, while factories save serious money spotting defects early. Tech companies are obsessed with them for debugging - makes sense since their systems are so complex. Aviation uses them too, which honestly makes me feel better about flying. Finance and consulting firms love structured approaches for obvious reasons. Any industry where screwing up costs big money or puts people at risk should try one. Your team would probably benefit if mistakes are expensive in your field.
Data collection is huge - honestly, your whole analysis is only as good as the info you're feeding it. Bad data means you're basically guessing, which sucks when you're trying to solve real problems. You need solid info to spot patterns and figure out what's actually broken versus what everyone assumes is broken (those are usually different things, btw). The better your data sources, the more accurate your model gets. I'd start by listing out where you can get data from, then focus on the most reliable stuff first. Quality beats quantity here.
Honestly, your brain just eats up visuals way faster than reading through paragraphs of stuff. I always start with flowcharts or those fishbone diagrams now - you'll spot patterns that would've flown right past you otherwise. Mind maps are clutch for seeing how different factors connect. Actually had a meeting last week where the whole room finally "got it" once we threw up a simple diagram instead of talking in circles. Short version: sketch it out first, then worry about the details. Makes presenting to people so much smoother too.
Honestly, the worst part is dealing with messy, incomplete data - happens every single time. People also pitch problems through their own biases instead of being objective about it. Scope creep will drive you nuts because everyone suddenly wants to analyze ten other things once you get started. Time's always an issue too since real analysis takes forever but stakeholders expect answers yesterday. Oh, and prepare for pushback when your findings contradict what people already believe. Set boundaries early, double-check your sources, and warn them upfront that the actual problem might be totally different from what they're thinking.
Problem analysis works great with agile actually. Both approaches break big messy problems into smaller chunks you can handle step by step. Use it during sprint planning to scope stories better, or when you hit roadblocks mid-sprint. I've watched teams completely blow entire sprints by jumping straight to coding without thinking it through first - such a waste! Keep the analysis lightweight though, not some heavy documentation nightmare. Quick collaborative sessions work best. Oh and try it during retros when the same issues keep popping up. You'll fix root causes instead of just putting band-aids on symptoms.
Honestly, I track a few things that actually matter. Did the fix work and stay fixed? How long did it take? Are people happy with the outcome? My favorite thing to measure is how fast we spot the real problem instead of chasing random symptoms - that's where teams usually get stuck. Resource efficiency matters too, plus whether you're getting quicker at this stuff over time. But here's the real test: would you tackle a similar problem the same way again? If yes, you nailed it. Don't try measuring everything though - pick 2-3 things and stick with them.
Honestly, AI is a game-changer for spotting patterns you'd miss completely doing things by hand. It chews through massive amounts of data to find root causes and can even predict where your next headache might come from. Machine learning gets really good at uncovering those weird connections - like when you suddenly realize why something keeps breaking every Tuesday (oddly specific but you know what I mean). You can test different fixes virtually before rolling them out too. Just make sure your data isn't a mess first, then let the algorithms work their magic.
Getting the problem definition right is huge - it's basically your roadmap for everything else. Mess this up and you'll waste weeks solving something nobody cares about (been there, it sucks). When you nail down the real problem, suddenly you know who to talk to, what data matters, where to focus your energy. Otherwise you're just wandering around hoping something sticks. I've seen teams build entire solutions that missed the mark completely because they never bothered to clarify what they were actually fixing. Honestly, spending extra time here saves you so much headache later. Trust me on this one.
Here's what's worked for me: First, write down your gut reaction about the problem, then force yourself to question each assumption. Bring in people from totally different teams - they'll catch stuff you're blind to. I learned this the hard way after missing obvious solutions because I was stuck in my usual thinking patterns. Data beats hunches every time, so dig into actual numbers instead of going with what "feels" right. Also, assign someone to be the annoying person who challenges everything you say. It's uncomfortable but super helpful. Different perspectives will save you from tunnel vision.
Start by showing them how you think through problems - literally talk through your process out loud when stuff breaks. People need to see it's safe to dig deep without getting thrown under the bus (seriously, this makes or breaks everything). Set up regular retrospectives where teams can practice together. Most folks rush to solutions because they feel crazy pressure to fix things NOW, but you can flip that by celebrating good analysis just as much as quick wins. Give them simple frameworks they can actually use. Oh and make problem-solving feel like they're developing a superpower, not just more boring work to do.
Honestly, you've got to match your communication style to whoever you're talking to. Executives want those flashy visual dashboards - they love the high-level stuff. Technical teams? Give them the meaty detailed reports they can dig into. For everyone else, keep it simple with one-pagers. Interactive presentations are where it's at though - people actually pay attention instead of scrolling their phones. Tell a story with your data. Show them why it matters, not just what the numbers say. Don't blast everyone with everything - filter what each group can actually do something about. Oh, and always include who's doing what next. Otherwise nothing happens.
-
Presentation Design is very nice, good work with the content as well.