

Procurement Spend Analysis Powerpoint Presentation Slides




Try Before you Buy Download Free Sample Product
 Impress Your
 Audience
 100%
100% Editable
 Save Hours
 of Time


This PowerPoint presentation depicts that Procurement analysis is an assessment of what happens in purchasing department, including whether or not they are adhering to the purchase strategy and managing stocks at optimal levels. Procurement analysts, agents, and managers may use this ppt to select which wholesale distributors or manufacturers will obtain their business. Check out our competently designed Procurement Spend Analysis PPT that includes templates for collecting data from various source systems such as ERPs, categorizing data into standard or use-case-specific categories, and displaying data in a visualization dashboard or within business intelligence tools. This presentation also covers analytics in category management, strategic sourcing, contract lifecycle management, procure-to-pay, sustainability, and CSR. Download our 100 percent editable and customizable template, which is also compatible with google slides.
People who downloaded this PowerPoint presentation also viewed the following :
Content of this Powerpoint Presentation
Slide 1: This slide introduces Procurement Spend Analysis. State Your Company Name and begin.
Slide 2: This slide states Agenda of the presentation.
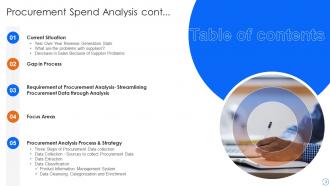
Slide 3: This slide presents Table of Content for the presentation.
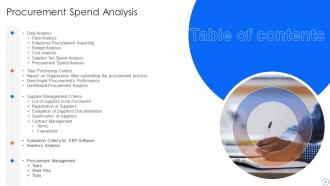
Slide 4: This is another slide continuing Table of Content for the presentation.
Slide 5: This slide highlights title for topics that are to be covered next in the template.
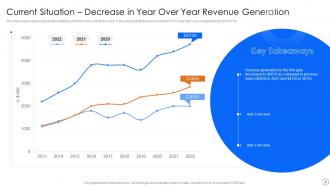
Slide 6: This slide covers revenue generation statistics of the firm over past three years.
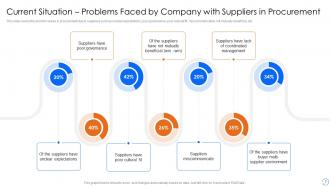
Slide 7: This slide displays the problem areas in procurement due to suppliers.
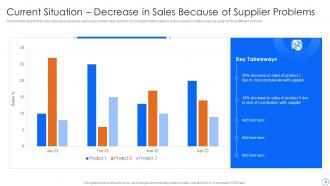
Slide 8: This template depicts that sales of products decrease due to miscommunication and lack of coordination.
Slide 9: This slide highlights title for topics that are to be covered next in the template.
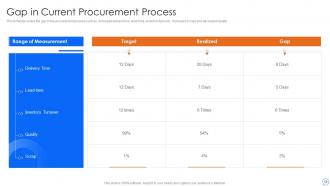
Slide 10: This slide represents Gap in Current Procurement Process.
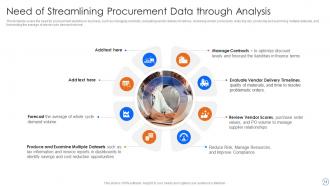
Slide 11: This slide showcases Need of Streamlining Procurement Data through Analysis.
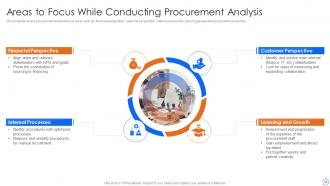
Slide 12: This slide shows Areas to Focus while Conducting Procurement Analysis.
Slide 13: This slide highlights title for topics that are to be covered next in the template.
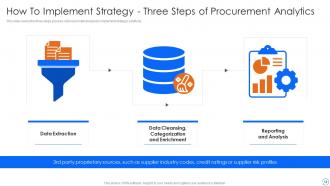
Slide 14: This slide covers the three steps process of procurement analysis to implement strategic solutions.
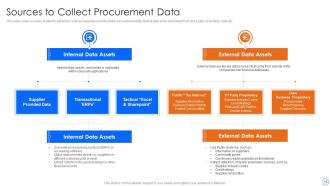
Slide 15: This slide showcases sources of data for extraction such as suppliers provided data, transactional data, tactical data, etc.
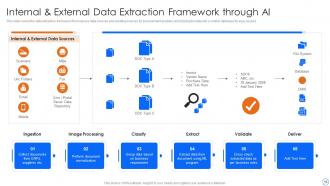
Slide 16: This slide shows Internal & External Data Extraction Framework through AI.
Slide 17: This slide highlights title for topics that are to be covered next in the template.
Slide 18: This slide presents Data Classification Process to form Product Information Management System.
Slide 19: This slide displays Data Cleansing, Standardization and Enrichment.
Slide 20: This slide highlights title for topics that are to be covered next in the template.
Slide 21: This slide represents Report & Analysis through KPIs and Waterfall Model.
Slide 22: This slide showcases Enterprise Procurement Reporting and Analysis.
Slide 23: This slide presents Budget Analysis for Procurement Management Services.
Slide 24: This slide displays Cost Analysis for Procurement Management Services.
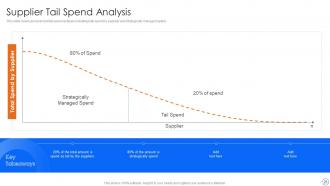
Slide 25: This slide covers procurement tail spend analysis including total spend by supplier and strategically managed spend.
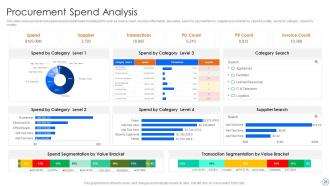
Slide 26: This slide displays procurement spend analysis dashboard including KPIs such as invoice count, invoices information, due dates, etc.
Slide 27: This slide highlights title for topics that are to be covered next in the template.
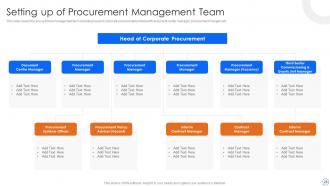
Slide 28: This slide represents Setting up of Procurement Management Team.
Slide 29: This slide covers the procurement analysis work plan including activities, responsibilities, time frame and performance indicators.
Slide 30: This slide showcases procurement analysis tools for purchasing control, easier RFQs, well managed inventory, etc.
Slide 31: This slide highlights title for topics that are to be covered next in the template.
Slide 32: This slide shows Evaluation Criteria For ERP Software To Conduct Procurement Analysis.
Slide 33: This slide presents Inventory Analysis for Procurement Analysis.
Slide 34: This slide highlights title for topics that are to be covered next in the template.
Slide 35: This slide covers suppliers list for purchasing material including country, program, procurement period, etc.
Slide 36: This slide displays Registration of Suppliers for Procurement Analysis.
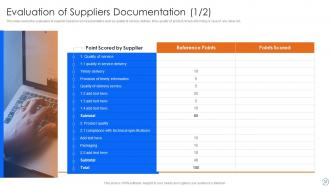
Slide 37: This slide covers the evaluation of supplier based on some parameters.
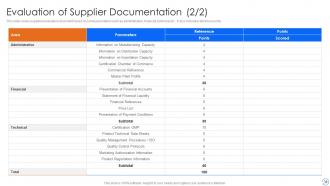
Slide 38: This is another slide continuing Evaluation of Supplier Documentation.
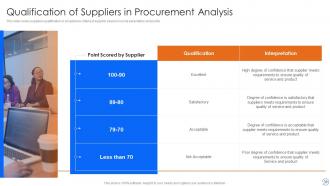
Slide 39: This slide represents Qualification of Suppliers in Procurement Analysis.
Slide 40: This slide highlights title for topics that are to be covered next in the template.
Slide 41: This slide covers contract management terms with suppliers or vendors in procurement analysis.
Slide 42: This slide showcases Contract Management Framework for Procurement Analysis.
Slide 43: This slide highlights title for topics that are to be covered next in the template.
Slide 44: This slide covers procurement purchase control details such as purchases made through POS.
Slide 45: This slide shows Impact of Procurement Analysis on Company Performance.
Slide 46: This slide highlights title for topics that are to be covered next in the template.
Slide 47: This slide presents Procurement KPI Performance Benchmark.
Slide 48: This slide covers the procurement analysis dashboard including KPI’s including total invoices, discount savings, etc.
Slide 49: This slide displays Icons for Procurement Spend Analysis.
Slide 50: This slide is titled as Additional Slides for moving forward.
Slide 51: This is Our Mission slide with related imagery and text.
Slide 52: This is Our Team slide with names and designation.
Slide 53: This slide provides 30 60 90 Days Plan with text boxes.
Slide 54: This slide shows Roadmap for Process Flow.
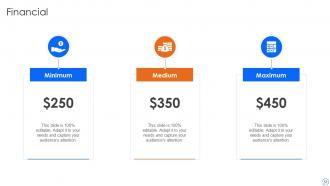
Slide 55: This is a Financial slide. Show your finance related stuff here.
Slide 56: This is another slide to show Financial data.
Slide 57: This slide depicts Venn diagram with text boxes.
Slide 58: This slide shows Post It Notes. Post your important notes here.
Slide 59: This is Our Target slide. State your targets here.
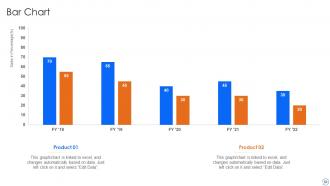
Slide 60: This slide presents Bar chart with two products comparison.
Slide 61: This is a Thank You slide with address, contact numbers and email address.
Procurement Spend Analysis Powerpoint Presentation Slides with all 66 slides:
Use our Procurement Spend Analysis Powerpoint Presentation Slides to effectively help you save your valuable time. They are readymade to fit into any presentation structure.
-

Procurement Spend Analysis
-
Procurement Spend Analysis
-
Procurement Spend Analysis cont
-
Procurement Spend Analysis
-
Procurement Spend Analysis
-
Current Situation Decrease in Year Over Year Revenue Generation
-
Current Situation Problems Faced by Company with Suppliers in Procurement
-
Current Situation Decrease in Sales Because of Supplier Problems
-
Procurement Spend Analysis
-
Gap in Current Procurement Process
-
Need of Streamlining Procurement Data through Analysis
-
Areas to Focus While Conducting Procurement Analysis
-
Procurement Spend Analysis
-
How To Implement Strategy Three Steps of Procurement Analytics
-
Sources to Collect Procurement Data
-
Internal External Data Extraction Framework through AI
-
Procurement Spend Analysis
-
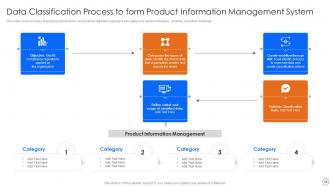
Data Classification Process to form Product Information Management System
-
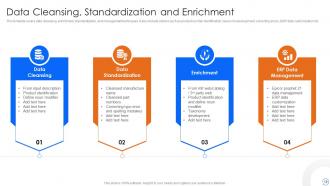
Data Cleansing Standardization and Enrichment
-
Procurement Spend Analysis
-
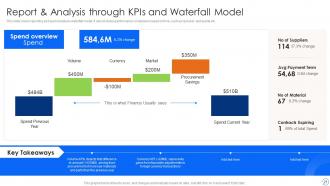
Report Analysis through KPIs and Waterfall Model
-
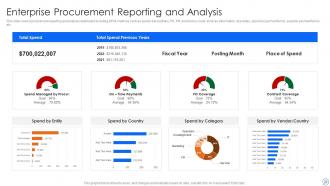
Enterprise Procurement Reporting and Analysis
-
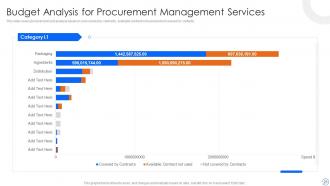
Budget Analysis for Procurement Management Services
-
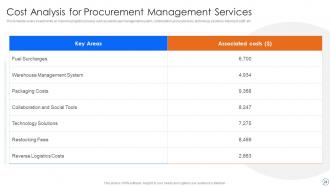
Cost Analysis for Procurement Management Services
-
Supplier Tail Spend Analysis
-
Procurement Spend Analysis
-
Procurement Spend Analysis
-
Setting up of Procurement Management Team
-
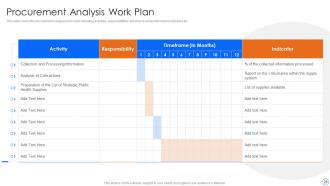
Procurement Analysis Work Plan
-
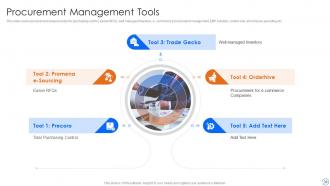
Procurement Management Tools
-
Procurement Spend Analysis
-
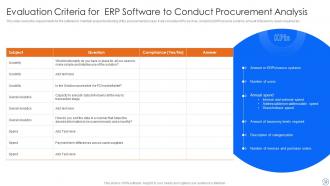
Evaluation Criteria for ERP Software to Conduct Procurement Analysis
-
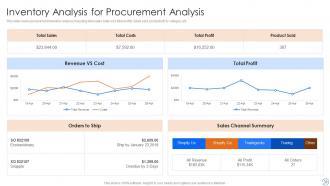
Inventory Analysis for Procurement Analysis
-
Procurement Spend Analysis
-
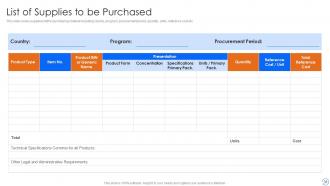
List of Supplies to be Purchased
-
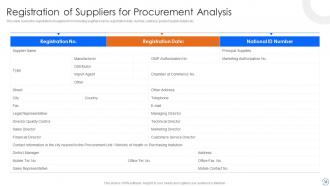
Registration of Suppliers for Procurement Analysis
-
Evaluation of Suppliers Documentation 1 2
-
Evaluation of Supplier Documentation 2 2
-
Qualification of Suppliers in Procurement Analysis
-
Procurement Spend Analysis
-
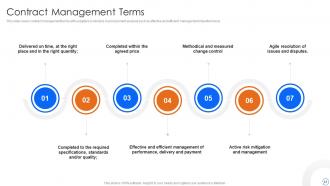
Contract Management Terms
-
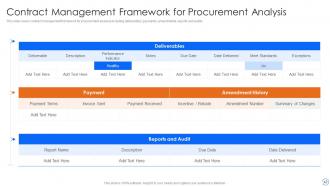
Contract Management Framework for Procurement Analysis
-
Procurement Spend Analysis
-
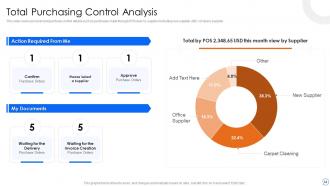
Total Purchasing Control Analysis
-
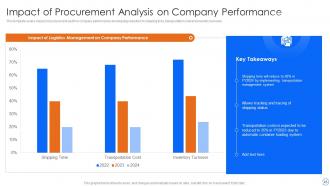
Impact of Procurement Analysis on Company Performance
-
Procurement Spend Analysis
-
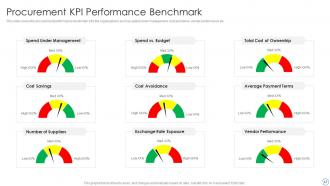
Procurement KPI Performance Benchmark
-
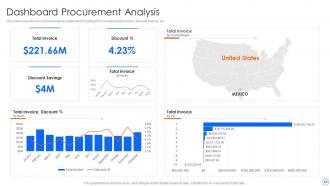
Dashboard Procurement Analysis
-
Icons Slide for Procurement Spend Analysis
-
Additional Slides
-
Our Mission
-
Our Creative Team
-
30 60 90 Days Plan
-
Roadmap for Process Flow
-
Financial
-
Timeline
-
Venn
-
Post it Notes
-
Our Target
-
Bar Chart
-

Thanks for watching
-

-

-

-

-

FAQs for Procurement Spend Analysis
Look, start with spend visibility - figure out where your money's actually disappearing first. Then dig into your suppliers and see who's performing vs who's just coasting. Category breakdowns help too, plus you gotta track contract compliance because people love to ignore those rules. Oh, and maverick spending? That off-the-books stuff will kill your budget if you're not watching. Price trends matter obviously - benchmark against market rates so you're not getting ripped off. Honestly though, clean up your data before doing anything else. Bad data just makes everything worse. Once that's sorted, you can actually spot real savings instead of shooting in the dark.
Start with three main buckets: direct materials (what goes into your actual products), indirect spend like office supplies and IT stuff, and services. Break those down by supplier and business unit, but seriously don't overthink the subcategories at first - I made that mistake and it was a nightmare. Being consistent with your naming is huge though. Get your team to agree upfront that "marketing services" and "advertising spend" are the same damn thing, not separate categories. Keep it simple initially, then you can add layers once you spot patterns. Way easier to build up than untangle a mess later.
Honestly, the biggest win is ditching those nightmare spreadsheets for something that actually thinks for itself. AI spots weird spending patterns and duplicate vendors automatically - stuff you'd never catch manually. Real-time alerts are clutch too, so you're not finding out about problems three months later when it's too late. The dashboards make your data actually readable for once, which stakeholders love. I'd probably start with a spend analytics platform that hooks into your ERP. Sounds fancy but it'll literally save you hours every week. Trust me on this one.
Honestly, spend analysis is just about getting the actual data before you make sourcing moves. Look at your biggest spend buckets first - that's where the real money is. You'll spot which suppliers have you by the throat and where you can actually consolidate without creating a mess. The sneaky part? It catches all those rogue purchases when departments buy random stuff behind procurement's back. Super annoying but happens everywhere. Pull your top 10 categories and map who's supplying what. That gives you real numbers to prioritize what's worth fixing first.
Honestly, start with cost savings - that's the obvious one everyone cares about. Track both hard savings from negotiations and what you avoided spending through smarter sourcing. Supplier performance is huge too: on-time delivery, quality scores, contract compliance. Because who cares if it's cheap if they can't actually deliver, right? You'll also want spend under management - basically how much you're actively controlling vs people going rogue and buying whatever. Oh, and cycle time for sourcing events. Speed matters way more than most people realize. Those four will give you a solid foundation to work from.
Start by pulling your spend data and looking for anything that bypassed normal procurement - suppliers not in your vendor system, purchases under thresholds that should've been bundled together, or departments buying random stuff they shouldn't. I'd go after the big dollar amounts first since that's where you'll actually move the needle. Filter out transactions from your contracted suppliers and approved categories. That'll show you the rogue spending pretty quick. Once you find the patterns, talk to those departments about why they went off-script - sometimes there's actually a good reason, like a gap in your contracts. Honestly, setting up regular reviews helps catch this before it spirals.
Oh man, the data situation is going to drive you crazy - invoices here, contracts there, spreadsheets literally everywhere. Vendor names won't match between systems, half the category codes will be missing, and don't even get me started on duplicates. Honestly, getting people to actually act on your findings might be even harder than cleaning the mess in the first place. Most procurement folks just want basic reports anyway. Here's what worked for me: fix your data quality first (boring but necessary), then tackle one category at a time. Trust me, trying to analyze everything simultaneously is a recipe for burnout.
Honestly, SAP Ariba and Coupa are amazing if you've got the budget - but they're expensive as hell. Power BI works really well for visualizing everything, and don't laugh but Excel pivot tables actually handle smaller datasets fine (you'll just hate life with big files). Zycus is a decent middle ground option. I'd figure out exactly what insights you're after first though - no point buying Ferrari-level software if you just need basic reporting. Tableau's solid too but can get pricey. What size company are we talking here?
Pull your spend data before meeting with suppliers - trust me on this one. You'll see exactly how much you're spending with each vendor, which gives you real negotiating power. Plus it shows awkward stuff like if you're always paying late (yikes). Look for chances to consolidate too. The magic happens when you can walk in and say "we've dropped $2M with you this year across these categories - let's talk partnership" instead of just asking for discounts. Way more strategic than the usual transactional BS.
Start with your biggest wins - show the top 10 suppliers eating up 80% of your budget. Nobody wants to click through boring PowerPoint slides, so go interactive. Let people dig into whatever catches their eye, from the overview down to individual transactions. Color-code everything the same way (seriously, this saves so much confusion later). Always throw in variance analysis comparing actual vs budget - that's where the real stories live. Honestly, if your CFO can't spot a savings opportunity within 30 seconds of looking at your dashboard, you've overcomplicated it.
Honestly, quarterly is your sweet spot. Monthly feels excessive unless you're dealing with crazy market swings or something. But yearly? You'll miss way too much stuff that could save you money. The thing about quarterly reviews is they sync up nicely with what finance is already doing, so less friction there. Plus you get actual meaningful data without going insane from overanalyzing everything. Here's what works: do your big deep-dive every quarter, then just peek at your biggest spend buckets monthly. That way you catch any weird spikes before they become real problems.
Honestly, spend analysis is perfect for this stuff. You can dig into which suppliers are terrible for the environment and see exactly how much you're blowing on carbon-heavy purchases. The cool part? It makes finding local vendors way easier, which obviously cuts shipping emissions. Plus you can consolidate suppliers - fewer vendors means less transportation overall. What I'd do is pull your biggest spend categories first (like top 20%) and just audit each supplier's green credentials. The data basically builds your business case for you since you can show the actual dollar difference between sustainable vs regular options. Way more convincing than just saying "we should be greener."
Start with cleaning up your vendor names and category codes first - seriously, this step matters more than people think. Build validation rules into your system so it catches duplicates automatically. I've watched entire teams spin their wheels for weeks analyzing crap data! Do quarterly audits where you compare spend data against actual invoices. Catches weird discrepancies fast. Short sentences help sometimes. But honestly, fixing this stuff upfront beats trying to untangle a mess later - way less painful that route. Oh and standardize those purchase descriptions too, makes everything searchable.
So compliance is annoying but actually super helpful for spend tracking. You're forced to document everything way more than you'd want - every transaction needs proper vendor classifications and audit trails. Healthcare, finance, government all have their own weird reporting rules that totally change how you set up your analysis. But here's the thing - all that required data collection? It gives you crazy good visibility into savings opportunities and risk patterns you'd never spot otherwise. I'd start by figuring out what compliance stuff you actually need to hit first, then just build your framework around those data points since you're collecting them anyway.
So basically, dig into your past 2-3 years of procurement data and you'll start seeing patterns everywhere. Seasonal stuff jumps out first - like how you always need more office supplies in September or whatever. Usage cycles become super obvious too. The cool part is tracking which categories grow consistently each year, plus you can spot lead time patterns and figure out when suppliers typically slow down. Honestly, it's kind of addictive once you get into it. Budget variances show up way earlier this way, so you're not scrambling later. Just pull the historical data and look for what repeats - that's your roadmap for planning ahead.
-
Thrilled to see several customizable templates catering various verticals and industries.
-
I faced no difficulty while searching for the slide I wanted. Honestly, the website’s interface is easy to use and can be navigated easily!