


Procurement Spend Analytics Overview Dashboard




Try Before you Buy Download Free Sample Product
 Impress Your
 Audience
 100%
100% Editable
 Save Hours
 of Time


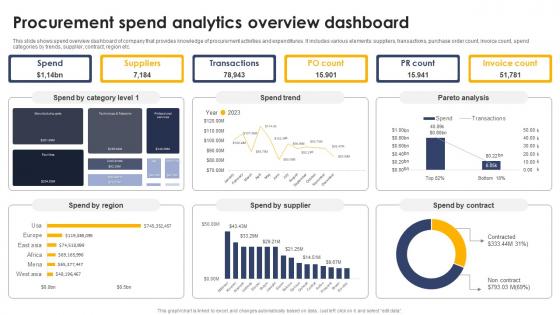
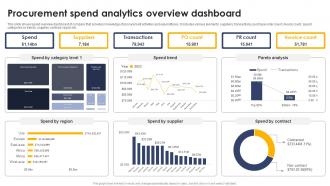
This slide shows spend overview dashboard of company that provides knowledge of procurement activities and expenditures. It includes various elements suppliers, transactions, purchase order count, invoice count, spend categories by trends, supplier, contract, region etc.
People who downloaded this PowerPoint presentation also viewed the following :
Procurement Spend Analytics Overview Dashboard with all 7 slides:
Use our Procurement Spend Analytics Overview Dashboard to effectively help you save your valuable time. They are readymade to fit into any presentation structure.






FAQs for Procurement Spend
Start with spend visibility - track where money's going by category and supplier. Maverick spend is a killer (people buying random stuff off-contract, trust me it adds up fast). Contract compliance rates matter too, plus how your savings stack up against targets. Supplier performance scores are pretty straightforward to measure. Don't forget cycle times and payment terms - those tell you if your process is actually working. Honestly, automated dashboards will save your sanity. Manual reporting is the worst. Get clean data flowing first, then worry about the fancy performance metrics later.
Honestly, the patterns that show up will blow your mind. Pull a spend cube report for your biggest categories first - you'll find duplicate vendors everywhere, departments paying wildly different prices for identical stuff, and random purchases that make zero sense. It's crazy how much money just disappears into weird spending habits. The data also shows which suppliers actually deliver vs the ones just coasting on old relationships. Real-time visibility beats guessing every time, plus the reporting basically runs itself once you set it up. Start with obvious consolidation opportunities - those are usually the biggest wins anyway.
Think of data governance as quality control for your procurement analytics. Without it, you're basically building insights on quicksand - garbage in, garbage out, right? You need clear definitions and validation rules so everyone measures spend the same way. Otherwise finance says one thing, purchasing says another, and nobody knows who's right (been there). Data lineage is huge too - when someone questions your numbers, you can actually trace where they came from. Start with an audit of your current sources. Find the biggest inconsistencies first - that's where you'll see immediate wins.
So machine learning basically crunches way more data than you could ever handle manually - historical spending, supplier metrics, market trends, all that stuff. The cool part? It actually gets better at predictions over time. You'll spot demand spikes before they hit and avoid those budget disasters that make your finance team lose their minds (been there). Plus it picks up on patterns from seasonality and economic shifts that are easy to miss otherwise. Just make sure you've got at least 2-3 years of clean data to feed it, or honestly the results will be pretty meh.
Honestly, the data situation will drive you insane - spend info is scattered everywhere and nothing matches up between systems. People hate changing how they work, especially procurement folks who've had the same supplier contacts forever. Integration? Good luck with that mess. My advice? Don't try to boil the ocean right away. Pick your ugliest data problem first and tackle one spend category at a time. I learned this the hard way when I tried fixing everything at once and burned out my whole team.
Dude, pull your spend reports before walking into any big negotiation - seriously. Show suppliers your exact purchase volumes and how much you're dropping with them vs competitors. Those hard numbers are pure ammunition. Seasonal patterns, category breakdowns, the whole spending picture laid out? That's when you can really push for volume discounts. Plus you'll spot chances to consolidate vendors, which honestly just gives you way more buying power. I learned this the hard way after getting steamrolled in a contract meeting once. The data tells your story better than any smooth talking.
Honestly? Go with specialized platforms like Coupa or Ivalua if you can - they're designed for this stuff. Tableau works too, especially if you already have it lying around. But here's the thing everyone misses: your data needs to be clean first or you're just making pretty charts of garbage. Excel's fine for smaller companies, though it becomes a nightmare once you hit bigger datasets. Oh, and whatever you pick, make sure it plays nice with your ERP system. Nobody wants to deal with a tool that requires an engineering degree to figure out.
So spend analytics basically turns into your supplier report card - tracks who's late, over budget, or actually crushing it. You can spot patterns in your spending and figure out which vendors deserve better contracts. Honestly, most companies work with way too many suppliers doing the same stuff, so you'll probably find consolidation opportunities. The real game-changer is having actual data when you're negotiating instead of just winging it. Run these reports monthly and don't be afraid to share the numbers with your suppliers - keeps everyone honest.
Spend analytics is perfect for catching compliance issues before they blow up. Track if your suppliers are hitting regulatory requirements and watch for weird spending patterns that scream fraud. Honestly, automated alerts are where it's at - set thresholds for spending limits and compliance violations so you're not scrambling later. You'll also see if you're way too dependent on one vendor, which can bite you. Contract compliance becomes way easier to monitor too. I mean, it beats finding out about problems after the fact when there's nothing you can do about it.
Start with the big picture stuff - total spend, savings opportunities, major supplier risks. Use clean charts and KPIs for your executive summary. Heat maps are honestly amazing for showing spend patterns by category or location, they make everything super obvious at a glance. Then you can drill down into category breakdowns and supplier scorecards. Don't fall for those flashy 3D charts - they just confuse people. Always include benchmarks so stakeholders can instantly tell if things are going well or if something needs fixing. Oh, and resist cramming everything onto one dashboard. Visual hierarchy beats information overload every time.
So spend analytics basically shows you where all your money's going, which is huge for sustainability stuff. You can call out suppliers doing sketchy environmental things and actually track carbon impact across everything you buy. Honestly, seeing it all mapped out is wild - you'll probably find some obvious fixes right away. Consolidating vendors usually cuts costs too, which is nice. I'd start by just comparing your current spending against whatever green criteria matter to you. Your finance team will love finding savings while hitting sustainability targets.
So category management is just grouping your spending into buckets - office supplies, IT stuff, raw materials, whatever makes sense for your business. Without it, you're flying blind honestly. Can't see patterns or figure out where you're bleeding money. Everything needs to be categorized the same way across departments though, otherwise you're comparing random things. I learned this the hard way at my last job - we had three different teams calling the same expense totally different names. Start with nailing down your category definitions first. Once that's sorted, the rest gets way easier.
Your historical spend data is basically a crystal ball for planning purchases. Look at 2-3 years worth - one year could just be weird circumstances, you know? Focus on your biggest spend categories first since that's where you'll actually see results. You can spot seasonal patterns, track when suppliers usually raise prices, and figure out your restocking timing. Don't forget to factor in any growth projections too. Honestly, this approach has saved me from so many last-minute scrambles where you're paying way too much because you didn't plan ahead.
Honestly, you can't do spend analytics solo - it's way too messy. Get procurement, finance, IT, and your business units talking to each other. Finance knows the budget side, IT deals with all that data integration headache (and trust me, it's always worse than expected), plus business units actually know why they're buying stuff. Without everyone chipping in, you'll miss huge chunks of context and nobody will trust your numbers anyway. Set up regular check-ins with these teams. Figure out how you're all defining things and what reports actually matter to people.
Yeah, spend analytics can be a game changer for smaller companies. You'll discover spending patterns that'll surprise you - like how scattered purchases really are across different vendors. Having actual data helps tons when negotiating with suppliers instead of just winging it. Look for places where you're buying the same stuff from multiple vendors or overpaying. Honestly, most businesses have way more maverick spending than they realize. Start with basic spend categorization first, then gradually add more sophisticated tracking. It's pretty wild what you'll uncover once you start digging into the numbers.
-
A perfect platform for all your presentation needs. Unlimited products at an affordable price.
-
No second thoughts when I’m looking for excellent templates. SlideTeam is definitely my go-to website for well-designed slides.