


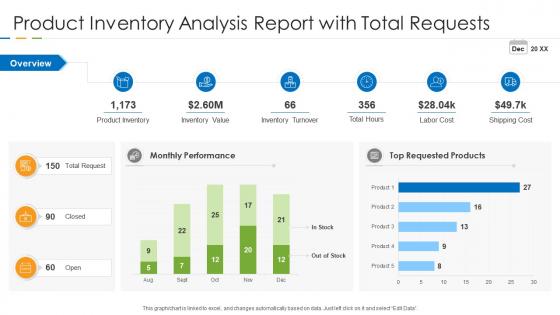
Product inventory analysis report with total requests




Try Before you Buy Download Free Sample Product
 Impress Your
 Audience
 100%
100% Editable
 Save Hours
 of Time


Our Product Inventory Analysis Report With Total Requests are topically designed to provide an attractive backdrop to any subject. Use them to look like a presentation pro.
People who downloaded this PowerPoint presentation also viewed the following :
Product inventory analysis report with total requests with all 7 slides:
Use our Product Inventory Analysis Report With Total Requests to effectively help you save your valuable time. They are readymade to fit into any presentation structure.






FAQs for Product inventory analysis report
Look at turnover rate first - shows how fast you're burning through inventory vs what's sitting around. Days sales outstanding matters too, plus stockout frequency and carrying costs as percentage of inventory value. Gross margin by product is critical since fast-moving stuff might barely make you any money (been there). Fill rate and safety stock levels help balance service with storage costs. Oh and pull these numbers monthly so you can catch trends early. Way better than getting stuck with dead inventory or running out of everything constantly.
So basically, take your cost of goods sold and divide it by your average inventory value - that's your turnover ratio. Low numbers? You've got dead stock eating up your cash flow. Super high ratios mean you're probably running out of stuff and missing sales (which honestly drives me crazy when I'm shopping). Different industries move at totally different speeds though - like fashion vs furniture is night and day. Compare your numbers each quarter and see how you stack up against competitors. Then use that info to buy smarter and maybe push suppliers for better payment terms.
So seasonality is pretty much everything when you're analyzing inventory. Look at your sales data from the past 2-3 years and you'll see clear patterns - like how winter gear obviously sells more in fall/winter, or electronics spike during back-to-school time. Plot it out and those trends will jump out at you. Without tracking this stuff, you'll end up overstocked when things are slow or scrambling when demand hits. Use those patterns to tweak your reorder points and safety stock. Honestly, it's one of those things that seems obvious but tons of businesses still mess it up.
Honestly, tech will save you so much time on all that manual tracking stuff. Inventory software shows stock levels instantly and pings you when things are running low. The barcode scanning is a game changer - I'm not even exaggerating. Analytics show which products are hot sellers vs. what's just sitting there collecting dust. Way better than catching mistakes in spreadsheets after the fact. My advice? Figure out what's driving you crazy first, then find software that fixes those specific headaches. Don't just go for the shiniest option with all the bells and whistles.
Ugh, the worst thing you can do is use old data - trust me, nobody wants swimsuits in December! Don't analyze products by themselves either. Look at whole categories and what people buy together. Companies always mess up lead times too, then wonder why they're constantly out of stock. Oh, and once you set up your analysis? Actually check it regularly. Markets shift crazy fast these days. I'd set up alerts for weird inventory spikes and review your whole approach every few months. The "set it and forget it" thing will bite you eventually.
Look at your last 2-3 years of sales first - that's your foundation. Then factor in the obvious stuff: seasons, holidays, any big promotions you ran. Weather data actually matters more than people think, depending on your business. I'd throw in economic trends and what competitors are doing too. Machine learning is fancy but honestly? A decent spreadsheet with moving averages will get you pretty far. The real trick is updating everything monthly with actual numbers and tweaking when weird stuff happens. Track how wrong you were last time - you'll get better at spotting patterns.
Honestly, bundling works great for moving extra stock - people eat up those "value deals." Try flash sales for your slow movers too. The real trick though? Look at your sales data and figure out which 20% of products make you 80% of your money. Focus there. For everything else, be way more aggressive about clearing it out. Just-in-time ordering helps prevent this mess in the future if you can nail down your demand patterns. Also hit customers with strategic discounts during your slow seasons - better to move inventory at lower margins than let it sit there collecting dust.
So here's the thing - every industry cares about totally different stuff when it comes to inventory. Retail is all about turnover rates and seasonal trends. Manufacturing? They're watching production cycles and how long it takes to get raw materials. Healthcare gets super intense about expiration dates and compliance (honestly can't blame them there). Tech companies focus on how fast their products become obsolete, which happens crazy quick these days. You gotta figure out what creates the biggest headaches and costs in your specific field first. Then build your whole analysis around those pain points.
Honestly, supply chain chaos means throwing out your old playbook. Just-in-time inventory? That's basically extinct now - learned that one the hard way. You gotta stock way more safety inventory and find multiple suppliers for everything. Build in extra lead time too because stuff always takes longer than expected. Get better forecasting software if you can swing it. Oh, and line up backup suppliers before you're desperate - they smell desperation from miles away. It's gonna cost more upfront, but beats explaining to customers why you're out of stock again.
Look at your sales data first - when stuff sells, how long suppliers take, all that. ABC analysis is clutch for figuring out which products are eating up your cash. Just-in-time works for predictable stuff, but honestly you'll always need buffer stock because suppliers are flaky sometimes. Set up automatic reorder points based on real numbers, not guesswork. Track your turnover monthly and tweak safety stock as needed. The goal? Don't sit on dead inventory but also don't run out of popular items. It's basically finding that sweet spot where you're not scrambling or drowning in excess stock.
JIT inventory is pretty solid for cutting costs - you're basically only buying what you actually need. Storage costs drop, less stuff expires, and you free up cash for other things. Your inventory moves way faster too, which makes the books look good. Honestly, most companies I've seen cut inventory costs by like 20-30% once they get the hang of it. The catch is you need rock-solid suppliers and decent forecasting. One screwup and you're out of stock. I'd say start with your fastest sellers first - test it out before you commit to the whole thing. Way less risky that way.
Honestly, visual analytics tools are a game changer for inventory stuff. They take all that messy spreadsheet data and turn it into dashboards you can actually understand. You'll see stock levels, turnover rates, seasonal patterns - all super clear. The best part? You can catch slow-moving products and potential stockouts way earlier. I swear the trend visualization alone will show you patterns you'd never spot otherwise. Plus you'll figure out which products actually make money (some surprises there, trust me). Start with your top 20 products to get the hang of it first.
ABC analysis is your starting point - sort stuff by high/medium/low value. Then layer on product categories, seasonal patterns, and how fast things move. Honestly, I always create a "problem child" bucket for expensive items that just sit there - trust me on this one. Supplier segmentation helps too, plus margin levels if you care about profitability (which you should). Don't go crazy with too many categories though. Pick 3-4 that actually help you make decisions. Oh, and review quarterly because priorities change faster than you think.
Honestly, digging through your old sales data is where the magic happens. Check what moved fast vs. what just sat there for the past year or so - it'll show you patterns you probably missed. Seasonal stuff becomes super obvious once you map it out. I get weirdly excited about this kind of detective work, but whatever works right? Set up those automatic alerts when stock hits your danger zone, because nobody wants to be that person scrambling at the last minute. Figure out your supplier lead times too. Way better than guessing and either running out or having your warehouse stuffed with junk nobody wants.
Honestly, you gotta go beyond basic turnover and pick stuff that actually moves the needle for your business. Retail? Watch your sell-through rates and stockouts when things get crazy busy. Manufacturing folks should track raw materials and how long work sits around. Healthcare's all about expiration dates and critical stock alerts - pretty obvious why that matters. Food service needs spoilage tracking and making sure old stuff gets used first. Don't just track everything because you can though. Pick the metrics that actually hit your profits and keep customers happy.
-
Graphics are very appealing to eyes.
-
Excellent Designs.