


Production Plant Maintenance Management Dashboard To Track Production Plant Machines Efficiency


Try Before you Buy Download Free Sample Product
 Impress Your
 Audience
Editable
of Time


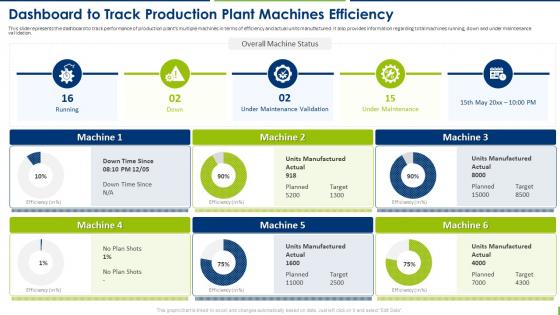
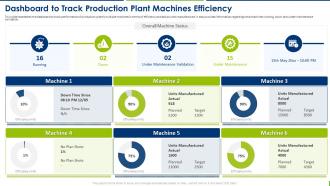
This slide represents the dashboard to track performance of production plants multiple machines in terms of efficiency and actual units manufactured. It also provides information regarding total machines running, down and under maintenance validation.
People who downloaded this PowerPoint presentation also viewed the following :
Production Plant Maintenance Management Dashboard To Track Production Plant Machines Efficiency with all 7 slides:
Use our Production Plant Maintenance Management Dashboard To Track Production Plant Machines Efficiency to effectively help you save your valuable time. They are readymade to fit into any presentation structure.


FAQs for Production Plant Maintenance Management Dashboard To Track Production
Start with OEE, MTBF, and MTTR - those three are your bread and butter for maintenance performance. Track your planned vs unplanned maintenance ratio too, plus maintenance costs as a percentage of asset replacement value. Work order completion rates matter, and honestly, schedule compliance is where most teams mess up even though it seems basic. Equipment availability and backlog trends round out the essentials. Oh, and don't sleep on schedule compliance - boring metric but it'll tell you everything about whether your team's actually got their act together. These eight will catch problems before they drain your budget.
So basically you put sensors on your equipment to catch problems before they blow up on you. Like when a machine starts vibrating weird or running hot - you get alerts and can fix it during your planned downtime instead of having everything crash at 2am (because that's always when it happens, Murphy's law). Most companies see 30-50% less surprise breakdowns this way. Plus you're doing small fixes instead of major overhauls, which saves money. I'd start with whatever equipment would screw you over most if it died - get those monitored first, then expand from there.
Look, real-time data basically lets you spot problems before they blow up into expensive disasters. You'll get instant alerts when temperatures spike or vibrations go weird - way better than waiting for your monthly inspection or equipment to just die. Honestly, it's probably the closest thing to predicting the future we've got right now. Prioritize fixes based on what's actually urgent instead of guessing. Schedule maintenance around real conditions, not arbitrary dates. Those surprise shutdowns? Yeah, you can mostly avoid them. Just don't set up so many alerts that you ignore them all - been there.
Honestly, a maintenance dashboard is a game-changer because it stops all that ridiculous back-and-forth between teams. Everyone can see real-time equipment status and who's handling what - no more calling around to figure out if the conveyor's broken or just getting cleaned. Your production team knows when downtime's coming. Maintenance can focus on what actually matters operationally. Management gets updates without bugging everyone constantly (which nobody likes anyway). Think of it like everyone finally looking at the same scoreboard instead of guessing. Set up alerts for critical stuff so the right people get pinged immediately.
Oh man, data formats are gonna be your worst enemy - some sensors spit out JSON, others use CSV, plus all the weird proprietary stuff. Network problems will drive you crazy too, especially around heavy machinery that messes with signals. Bandwidth gets sketchy when you're pulling real-time data from tons of sensors at once. Then there's all the garbage data - missing timestamps, duplicates, sensors that drift over time. Honestly, I learned this the hard way, but map out your data sources first. Trust me, it'll save you so much headache down the road.
Honestly, UI can make or break your whole dashboard. I've watched teams just ditch tools that worked fine but were a nightmare to use. When everything's cluttered or critical alerts get lost in the mess, your techs either miss urgent stuff or spend forever hunting for basic info. Put the important things right up front - active alarms, equipment status, that kind of thing. Clean layouts help people spot problems quickly instead of clicking around like crazy. Definitely test it with actual users though. You'll be surprised how differently people navigate compared to what you'd expect.
So there's a bunch of metrics you can track, but honestly don't overwhelm yourself. OEE is probably the most useful - it rolls availability, performance, and quality into one clean number. MTBF and MTTR are solid too since they show how often things break and how quick you are at fixing them. I'd also watch maintenance costs per unit and your planned vs unplanned ratio. That last one's huge because unplanned downtime kills your budget. Pick maybe 2 or 3 that actually matter for your setup and build some simple dashboards. No point tracking everything if you're not gonna act on it.
Honestly? Real-time is ideal but every 15-30 minutes works for most stuff. Critical alerts need to be instant though - you don't want to find out about equipment failures hours later. That's just asking for trouble. For the less urgent things like scheduling and inventory, hourly updates are totally fine. I'd start with 15-minute refreshes and see how your system handles it. Too many updates can bog things down, which defeats the purpose. Really depends on what your team checks most often.
So for your plant maintenance dashboards, I'd probably go with Power BI or Tableau first - they're solid and connect well to industrial stuff. Grafana's actually really good for equipment monitoring, especially if you've got tons of sensor data coming in. Your team could also build something custom with React and D3.js if they're into coding (though that's obviously more work). Oh, and some people love those CMMS platforms like Fiix that already have dashboards built in. Honestly though, I'd figure out what data sources you're working with first. That'll basically decide which tool makes the most sense for your setup.
Look, maintenance dashboards are honestly a game changer - you get real-time alerts when equipment's about to crap out. No more surprise breakdowns killing your production schedule. All your maintenance schedules, performance data, and predictive warnings live in one spot. My buddy at the Ford plant swears by theirs. You can actually plan repairs during downtime instead of scrambling when stuff breaks. The trick is picking the right metrics to track and not ignoring the system when it's screaming at you that something needs fixing.
Honestly, ditch the slide presentations and just let people click around the actual dashboard - they'll pick it up way faster. Different roles need different training though, so don't lump your maintenance guys in with the supervisors. Real data beats fake examples every time, trust me on this. Oh, and you'll definitely want refresher sessions because people absolutely will forget features they don't use constantly. Find someone on your team who gets excited about this stuff and make them your go-to person for questions. Way easier than being the only one who knows anything.
Honestly, your maintenance records are like having a time machine for planning. Look for patterns in when stuff breaks down - you'll start seeing trends by season or equipment age. Then you can actually plan downtime during slow periods instead of scrambling when something dies unexpectedly. Track how long repairs really take too, because we always think it'll be "just a quick fix" and it never is! Focus on your most critical machines first and see what keeps failing. If certain equipment is becoming a headache, you'll want backup options ready. Pull those reports and dig into the recurring problems.
Dude, mobile access is huge for maintenance teams. Instead of running back to a computer every time, they can check equipment status and work orders right on the plant floor. Your techs can snap photos of problems, update logs, and even pull up manuals while they're standing next to the broken machine. Response times get so much better. Supervisors can approve urgent stuff from anywhere too, which honestly saves a ton of headaches. Oh, and start with tablets - way more durable than phones for that environment.
Figure out what actually matters first - downtime costs, which equipment breaks everything if it fails, maintenance backlogs piling up. Your operators need to see the important stuff at a glance, not fancy charts that just impress the boss (though yeah, keep them happy too). Group similar metrics and use obvious colors - red means panic, green means chill, yellow means pay attention. Fast loading is huge since people check these on phones while walking around the plant. Oh and definitely talk to the techs after they've used it for a bit. They'll tell you what's useless.
Look, regulatory stuff basically forces your hand on what goes on the dashboard. OSHA metrics, EPA emissions, safety standards - all that has to be visible upfront, not hidden in some submenu nightmare. Inspectors want to see audit trails and maintenance schedules immediately when they show up. Start by making a list of every regulation hitting your plant, then figure out which dashboard widgets cover each one. Some of these rules are honestly ancient but whatever, you're stuck with them. The trick is putting compliance data right where people can grab it fast. Don't make anyone hunt around - that's just asking for trouble during an audit.
-
Presentation Design is very nice, good work with the content as well.
-
Great product with highly impressive and engaging designs.