


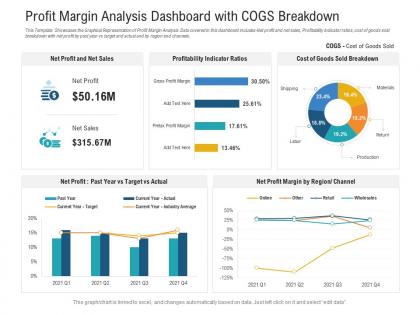
Profit margin analysis dashboard with cogs breakdown powerpoint template




Try Before you Buy Download Free Sample Product
 Impress Your
 Audience
 100%
100% Editable
 Save Hours
 of Time


Our Profit Margin Analysis Dashboard With Cogs Breakdown Powerpoint Template are topically designed to provide an attractive backdrop to any subject. Use them to look like a presentation pro.
People who downloaded this PowerPoint presentation also viewed the following :
Profit margin analysis dashboard with cogs breakdown powerpoint template with all 2 slides:
Use our Profit Margin Analysis Dashboard With Cogs Breakdown Powerpoint Template to effectively help you save your valuable time. They are readymade to fit into any presentation structure.
FAQs for Profit margin analysis dashboard with cogs
So profit margins basically come down to a few big things. How cutthroat is your competition? Retail gets absolutely crushed because everyone's fighting over the same customers. Your costs matter too - manufacturing has those brutal fixed costs while other businesses scale easier. Newer industries usually have sweet margins until everyone piles in (classic cycle). Then you've got stuff like healthcare dealing with regulations that just drain money. I'd honestly just look up what others in your space are pulling in first - gives you a reality check on whether you're doing okay or not.
Okay so your cost structure basically decides what numbers go where when you're calculating margins. Like, high fixed costs? Your gross margin might look fine but then operating margin gets crushed - happens more than you'd think. Variable costs mess with gross margin right away, but fixed costs get spread out over volume and hit your operating margins instead. Honestly, just map out your costs first before doing any calculations. List everything you spend money on, then sort it into COGS, operating expenses, or whatever other buckets make sense. Otherwise you'll end up with wonky numbers that don't actually tell you anything useful.
Gross margin is just revenue minus what it costs to make your stuff - super straightforward. Operating margin digs deeper and takes out all the other expenses like payroll, rent, utilities. Net margin? That's after literally everything gets deducted - taxes, loan payments, you name it. Honestly, I'd check all three monthly because they each tell you something different about where you're losing money. Like gross might look great but operating could be trash because you're spending too much on overhead. It's kind of like those Russian dolls - each one shows a different layer of your actual profitability.
Think of profit margins like a health checkup for your business. Track them over time and you'll catch problems before they get bad. Gross margin drops? Your suppliers probably jacked up prices or there's waste somewhere. Operating margins are where most people get blindsided though - all those "tiny" admin costs pile up way faster than you'd expect. I always tell people to look for weird patterns first, then dive into whatever seems off. It's honestly the fastest way to figure out where your money's disappearing.
Honestly, pricing is your biggest profit booster - way more impact than cutting costs. Just don't go crazy with random increases (trust me on this one). Test small bumps first, maybe 5%, with customers who aren't super price-sensitive. If demand holds steady, that tiny increase can actually boost your profits by like 20-30%. Wild, right? Look at what competitors charge and really think about how customers see your value. Different customer groups will react differently to price changes. Oh, and always start small - you can always raise prices again later, but it's awkward as hell to walk them back.
Check out IBISWorld or Risk Management Association reports - they break down margins by company size and sector. Yeah, they're expensive but totally worth it. Also dig into 10-K filings from public companies doing similar stuff. Just make sure you're comparing the right type of margins (gross vs net vs operating) because that'll throw you off completely. I'd start with maybe 3-5 direct competitors and track them quarterly. Oh, and your trade association might have this data for way cheaper than the big research firms.
Start with Excel or Google Sheets honestly - they're still the best for this stuff and you can control everything. QuickBooks and Xero have decent reporting if you want something more automated, plus they'll break things down by product line which is super helpful. Power BI's amazing for bigger datasets, though it might be overkill depending on your situation. Tableau's also solid for tracking trends over time. I'd honestly just start simple with a spreadsheet first - get your formulas right, then move to fancier tools later if you need them.
Ugh, seasonal swings are the worst for margins because everything gets out of whack. Peak season means more sales, sure, but you're also paying crazy labor costs and rush shipping fees. Then off-season hits and you're still stuck with rent and utilities while revenue tanks. The annoying thing is some costs follow the calendar instead of your actual sales - like heating bills or holiday staff. I learned this the hard way last year. Track your margins month by month and compare to the same months from previous years. Don't just look at quarterly numbers because they'll hide the real patterns.
Oh man, FX rates are brutal for international businesses. Your home currency gets stronger? Great, except now your overseas sales convert back to way less money. Weaker currency does the opposite - more revenue when converted, but suddenly all your imported stuff costs a fortune. The timing is what really gets you though. Rates bounce around daily, so profitable quarters can turn ugly fast. Honestly, you've gotta hedge against this stuff and run different exchange rate scenarios when you're planning. Otherwise you're just gambling with your margins.
Honestly, customer segmentation completely flips how you look at profit margins. Different groups have totally different profitability - like, your "premium" customers might actually cost way more to serve than they bring in. Meanwhile some smaller revenue segments are crazy profitable. I've literally seen companies realize their biggest clients were draining profits! Break down margins by your top 3-5 segments and you'll probably be shocked. Then you can tweak pricing or service levels based on who's actually making you money versus just bringing in revenue. The insights are usually pretty eye-opening.
Fixed costs are honestly brutal - they'll make you rich when sales are good but destroy you when they're not. Think about it like this: sell more stuff and those costs get spread out, so your margins look amazing. Sales tank though? You're still paying rent, salaries, equipment leases while money stops coming in. I learned this the hard way with my first business actually. Your breakeven point becomes super important to know by heart. Build some buffer into your sales projections because when fixed costs bite, they bite hard. It's basically feast or famine.
So profit margin analysis is actually super useful for forecasting - way more than people think. Pull your last 2-3 years of data and look for patterns. Seasonal stuff, cost changes, whatever keeps showing up. Here's the thing though: don't just look at overall company numbers. Break it down by product or division because that's where you'll spot which areas are gonna crush it or totally tank. I used to just glance at the big picture and miss so much detail. Track how margins shift over time and you'll start seeing trends that make your predictions way sharper.
Yeah so service businesses usually have better margins since you're not buying materials - just paying people and covering overhead. Product companies get hit with all those material costs plus storing inventory, which sucks. But here's what's tricky about service margins - they don't always show the real cost of finding and keeping good people. With products, watch your gross margins and how fast inventory moves. Services? Look at utilization rates and billable hours instead. Oh, and definitely compare yourself to others in your exact space, not just random businesses.
Yeah, supply chain changes hit your margins hard both ways. Shipping costs spike or suppliers raise prices? Your margins tank unless you bump up customer prices. Finding cheaper suppliers or better efficiency does the opposite though. Honestly, timing's the worst part - these shifts happen way faster than you can react with pricing changes. I'd watch your key supply chain numbers like a hawk. Build some wiggle room into your pricing strategy too, otherwise you're always scrambling to catch up when stuff goes sideways.
Honestly, most small businesses are leaving money on the table with their pricing - don't be scared to charge what you're actually worth. Track your margins monthly (boring but necessary) so you can catch problems early. Look at which products make you the most money and push those harder. Also negotiate with suppliers - they expect it anyway. Cut the waste and automate stuff that's eating up your time. I know a guy who doubled his profits just by raising prices 15% and nobody even complained. Focus on costs, pricing, and making things run smoother.
-
Informative design.
-
It saves your time and decrease your efforts in half.
-
Enough space for editing and adding your own content.
-
Helpful product design for delivering presentation.
-
Innovative and Colorful designs.
-
Qualitative and comprehensive slides.
-
Awesomely designed templates, Easy to understand.