

Roi Calculation Powerpoint Presentation Slides





Try Before you Buy Download Free Sample Product
 Impress Your
 Audience
 100%
100% Editable
 Save Hours
 of Time


Highlight your financial business data in a professional way with our ROI calculation PPT template. Our dedicated designing team has made this brilliant Presentation possible. Representing the data can sometimes be problematic as you need to ensure that all the information is shown way which is easily understandable by your audience. Our ROI calculation PowerPoint slideshow consists of ready-made PPT slides with graphics, icons and visuals to represent your important financial numbers and statistics. Return on investment is a measurement of efficiency in converting your business investment into profit. Therefore, it is vital to projecting whether a business venture is worthwhile and what adjustments to make once a company is active. The content is extensively researched, and designs are professional in this ROI calculation Presentation deck. So, create the proper datasheets, tables and charts for your financial data and then work towards analyzing it. Download the slideshow now. Our Roi Calculation Powerpoint Presentation Slides are reviewed from day to day. They are designed to keep you in front.
People who downloaded this PowerPoint presentation also viewed the following :
Content of this Powerpoint Presentation
Slide 1: This slide shows ROI Calculation with relevant imagery.
Slide 2: This is an Agenda slide. State company agendas here in a professional manner.
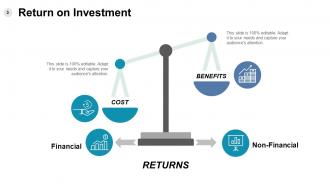
Slide 3: This is Return on Investment slide showing COST, BENEFITS, RETURNS, Non-Financial, Financial aspects.
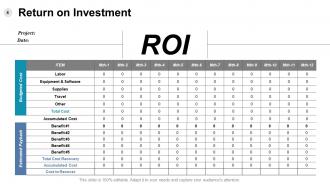
Slide 4: This is also a Return on Investment slide which shows Budgeted Cost, Estimated Payback.
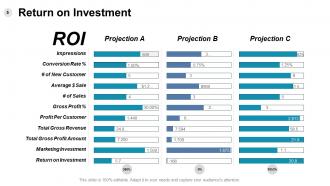
Slide 5: This is another slide showing Return on Investment of Projection A, Projection B and Projection C simultaneously.
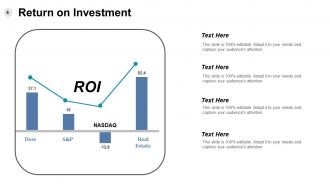
Slide 6: This slide shows the Return on Investment graph.
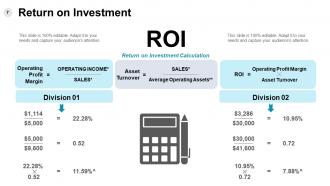
Slide 7: This too is a Return on Investment slide showing Return on Investment Calculation formula. Use this formula to calculate your own return on investment.
Slide 8: This slide displays Return on Investment Icons. Use as per your business requirement.
Slide 9: This slide is titled Additional Slides to move forward. You can change the slide content as per need.
Slide 10: This slide showcases Meet Our Team with designation, text boxes and image to fit.
Slide 11: This is a Quotes slide to convey company/ organization message, beliefs etc. You may change the slide content as per need.
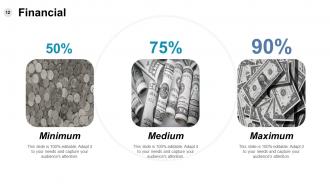
Slide 12: This slide shows Financial score. State financial aspects here.
Slide 13: This is a Mind Map image slide with text boxes to fill information.
Slide 14: This is a MATRIX slide. Put relevant comparing data here.
Slide 15: This is a Timeline slide to present important dates, journey, evolution, milestones etc.
Slide 16: This is a Target image slide. State targets, etc. here.
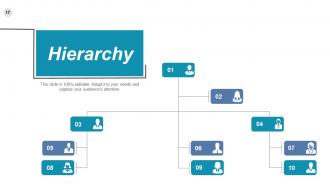
Slide 17: This is a Hierarchy image slide to show information, organization/ team structure, specifications etc.
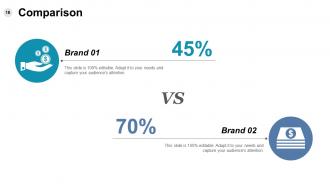
Slide 18: This slide shows a Comparison between two brands.
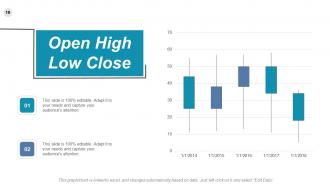
Slide 19: This is an Open High Low Close Chart slide to present product/ entity comparison, specifications etc.
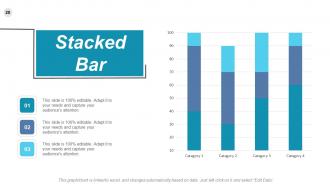
Slide 20: This is a Stacked Bar chart slide to present product/ entity comparison, specifications etc.
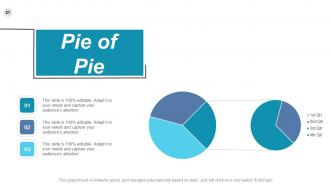
Slide 21: This is a Pie of Pie Chart slide to present product/ entity comparison, specifications etc.
Slide 22: This is Thank You slide stating Address# street number, city, state, Contact Numbers, Email Address.
Roi Calculation Powerpoint Presentation Slides with all 21 slides:
Identify good holiday destinations with our Roi Calculation Powerpoint Presentation Slides. Enumerate all the advantages in detail.





FAQs for Roi Calculation
You'll need two things: total campaign costs and revenue that actually came from it. Don't just count ad spend - factor in creative costs, your time, tools, all that stuff. Use UTM codes or promo codes to track what revenue really belongs to the campaign. Otherwise you're just guessing, honestly. The math is straightforward: (Revenue - Costs) / Costs × 100 gets you your ROI percentage. Set up tracking right from the start though. I've seen people wait until the end and then panic trying to figure out what actually worked - it's a mess.
Honestly, measuring long-term ROI is trickier than most people think. You'll want to track stuff for at least 3-5 years - both the obvious financial metrics and the softer stuff like brand reputation. Cash flow beats simple profit calculations every time since it shows actual money moving around. Set up checkpoints along the way instead of just waiting for the final numbers. Oh, and definitely establish your baseline before you start investing (learned that one the hard way). I'd create some kind of quarterly dashboard to spot trends early. Don't sleep on indirect benefits either - employee retention and brand improvements are worth real money.
The timeframe you pick for ROI calculations totally changes everything. A project might look terrible in year one but be amazing over three years - I've seen this mess up decisions so many times. You've got to match your calculation period to what you're actually trying to figure out. Are we talking about quarterly stuff or some big five-year investment? That choice will flip which options look good. Always nail down your time horizon first, otherwise you're comparing completely different things. It's like... you wouldn't judge a marathon runner at mile two, right?
Dude, templates are honestly a game changer for ROI presentations. They keep you organized so you don't forget the big stuff - investment costs, timeline, returns, risks. No more rambling through slides hoping you covered everything. Clean formatting makes you look way more professional than some random PowerPoint mess (learned that the hard way). People can actually follow your logic when sections are predictable. Start basic: exec summary, your methods, key numbers, what you recommend. Then tweak it for whoever you're presenting to. Takes like 10 minutes to set up but saves you hours later.
Dude, biggest thing I see people mess up? Cherry-picking timeframes to make their numbers look amazing. Don't do that. Also you can't just ignore all the hidden costs - training, implementation, ongoing maintenance stuff adds up fast. Present conservative scenarios alongside your best-case projections because honestly, stakeholders aren't idiots. They'll ask how you got those numbers and what could tank the whole thing. I've watched so many presentations crash because someone glossed over the risks or presented ROI with zero context. Oh and always be ready to defend your methodology when Karen from finance starts grilling you.
Dude, ROI benchmarks are totally different depending on what industry you're in. Tech startups shoot for like 20-30% because they're basically gambling on the next big thing. Meanwhile utilities are perfectly content with 8-12% - boring but stable, you know? Manufacturing usually hits around 15-20%, but retail is honestly a mess and varies wildly based on their margins. Healthcare and pharma companies expect way higher returns since they're dealing with all that regulatory nightmare stuff plus years of development. Don't just Google "good ROI" - you gotta look up what's normal for your specific industry and company size.
Honestly? Just start with Excel or Google Sheets. I know it sounds boring, but you can build exactly what you need without dropping cash on fancy software. QuickBooks has some ROI stuff built in if you're already using it. Monday.com is pretty user-friendly too, and HubSpot's great but maybe overkill for smaller operations. Tools like Salesforce can automate the heavy lifting once you get bigger. But real talk - I've seen people overcomplicate this with expensive platforms when a solid spreadsheet template does like 90% of the job. Save your money for now and upgrade later when you're actually drowning in data.
Honestly, it depends what you're measuring. Product development ROI is weird - I'd look at lifetime customer value vs development costs, plus how fast features get adopted. Customer acquisition is way easier since you just compare what you spend to bring people in against what they actually buy. The annoying thing is timing though. Product stuff might not pay off for years while acquisition ROI shows up pretty quick. I'd probably set up different time windows for each type of project. Oh, and don't just track the money - include some early warning signals too so you're not flying blind.
Honestly, most people totally underestimate how much this stuff matters. You can't just look at hard numbers - employee satisfaction, brand rep, customer loyalty all translate to real money eventually. Reduced turnover alone saves a fortune. I've watched so many good projects die because they couldn't put a price on the "soft" stuff. Even if you're basically guessing, throw conservative dollar amounts on your biggest intangible benefits. Makes your ROI way more believable. Plus finance people love seeing everything quantified, even the fuzzy bits.
Honestly, start with Customer Acquisition Cost and Customer Lifetime Value - that ratio tells you everything. Conversion rate's obviously huge too. I'd throw in Average Order Value, but seriously, don't get sucked into tracking page views and other BS metrics that look impressive but mean nothing. Your return on ad spend matters if you're running campaigns. Oh, and track gross margin per customer because I've seen people celebrate revenue while losing their shirts on shipping costs. Those three core metrics first, then expand from there once you've got a handle on the basics.
Dude, volatile markets make your ROI calculations look insane - like you're a genius one month then garbage the next. Break your numbers into quarterly chunks instead of looking at the whole year. Rolling averages smooth out those crazy swings way better. Also compare your stuff to market indices so you know if you're actually good or just got lucky riding a bull run (happened to me more than I'd like to admit). Honestly, recalculate last year using smaller time periods. You'll see what's really working versus what was just timing.
Yeah, so negative ROI basically means you're bleeding money - put in more than you got out. Sucks, but honestly happens way more than people admit, especially with new stuff or when markets go crazy. First thing? Figure out what went wrong. Bad execution, unrealistic goals, or just crap timing you couldn't control? If it's fixable stuff like targeting the wrong people or messy processes, tweak it and give it another shot. But here's the thing - if the whole concept is fundamentally broken, just cut your losses. I've seen too many people keep dumping money into dead-end projects thinking they can turn it around.
Look, CLV completely flips how you calculate ROI. Instead of just checking immediate returns, you're looking at what each customer brings in over their whole relationship with you. That pricey acquisition campaign looking awful this quarter? Could be genius if those people stay loyal for years. Think about it like buying a decent coffee maker vs. grabbing Starbucks daily - upfront cost hurts but pays off long-term. You've gotta calculate ROI across the customer's expected lifespan, not just their first buy. Track how long customers typically stick around and their spending habits. Makes your projections way more realistic.
Ok so gross ROI is just your basic return divided by what you invested - pretty straightforward. Net ROI though? That's where it gets real because you're subtracting all the annoying stuff like taxes, fees, maintenance costs. I learned this the hard way honestly. Gross makes everything look amazing on paper, but net shows what you actually pocket. Like, I've seen people get excited about a 15% gross return only to realize they're barely breaking even after expenses. Always go with net when you're deciding whether something's worth it - trust me on this one.
Real case studies work so much better - show actual dollars, timelines, the whole mess. I learned this the hard way after watching people zone out during presentations with fake examples. Pick cases that match your audience's world and walk through calculations live on screen. Don't sanitize it either - include the surprise costs and delays because honestly, that's what makes people trust you. Always throw in one failure story to show what goes wrong. End each one by breaking down exactly what separated the wins from the disasters.
No Reviews