


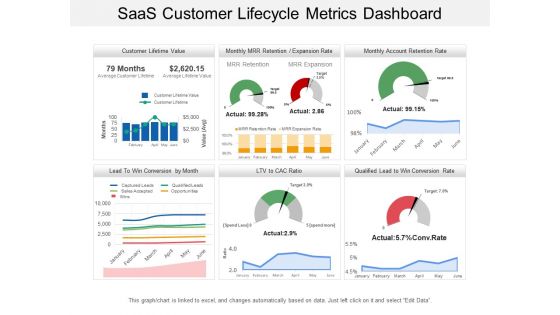
Saas customer lifecycle metrics dashboard




Try Before you Buy Download Free Sample Product
 Impress Your
 Audience
 100%
100% Editable
 Save Hours
 of Time


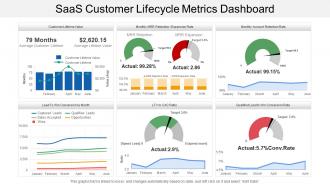
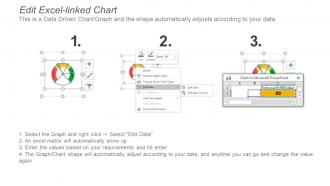
Check out our Saas customer lifecycle metrics dashboard PPT template. For any SaaS business to have success, it must find a way to increase customer value over their lifecyle. Increasing customer lifetime value offsets revenue lost to churn, reduces the acquisition-cost-to-revenue ratio and generally sets the business up for sustained success. All this can be showcased with our Saas customer lifecycle metrics dashboard PowerPoint graphic as it makes it extremely easy to convert your business information into editable charts. The PPT slide has professional graphs and charts which are linked to excel sheets. So, you can change the values of these charts and graphs as per the information you want to represent. Also, ample space has been provided beside the charts so that you can enter important points related to the chart and its categories. This Saas customer lifecycle metrics dashboard presentation diagram assists you to display your financial information in the best possible manner. Counter economic depression with our Saas Customer Lifecycle Metrics Dashboard. Generate alternative avenues of employment.
People who downloaded this PowerPoint presentation also viewed the following :
Saas customer lifecycle metrics dashboard with all 6 slides:
Give greater attention to critical details with our Saas Customer Lifecycle Metrics Dashboard. You will acquire the desired emphasis.


FAQs for Saas customer
Track these five metrics religiously: MRR, CAC, LTV, churn rate, and Net Revenue Retention. MRR shows your growth trajectory. CAC and LTV tell you if you're actually making money per customer (shocking how many founders ignore this). Churn rate is huge - if people keep leaving, you're basically filling a leaky bucket. Net Revenue Retention shows whether existing customers are spending more over time. Oh, and start tracking from day one even when your numbers are embarrassingly small. I learned this the hard way - you can't fix what you don't measure.
Look, churn rate is make-or-break for SaaS companies. Lose customers faster than you gain them? You're basically hemorrhaging money. The math gets ugly quick - even going from 5% to 10% monthly churn will absolutely wreck your business over time. Here's the thing: constantly spending on new customers just to replace the ones leaving kills your profit margins. It's way more expensive than just keeping who you already have. I've seen too many startups obsess over growth while ignoring retention. Fix your churn problem first, then worry about scaling up.
So CAC is just what you're spending to get each new customer. Pretty crucial for SaaS since you need those subscription payments to add up over time. Like if you're dropping $500 to acquire someone but they only pay $300 before bailing - yeah, that's a problem. I always tell people to track this monthly because it'll make or break your unit economics. The sweet spot? Keep your customer lifetime value at least 3x higher than your CAC. Honestly, once you start watching these trends, you'll become obsessed with optimizing them.
Most customers who'll churn make that decision super early - like within the first month or two. So nail your onboarding first. Get them to those "aha moments" fast where they actually see why your product rocks. Don't just wait around for cancellations to happen (honestly, that's way too late). Watch stuff like how often people log in, which features they're using, even the tone of their support tickets. Set up alerts when accounts start looking sketchy. Have your customer success team jump in proactively when something seems off. But start by figuring out your top 3 reasons people leave and build specific game plans for each one.
MRR gives you a solid baseline for forecasting since it's predictable revenue you can actually count on. Track your month-over-month growth rates and you'll start seeing patterns emerge. Way better than trying to predict one-time sales - those are all over the place. Break it down by new customers, expansions, and churn so you know what's actually moving the needle. Different scenarios become easier to model too, like "what if we reduce churn by 2%?" Honestly, even a basic spreadsheet beats flying blind. The cohort analysis part gets nerdy but it's worth it.
CLTV is just ARPU divided by churn rate. Monthly ARPU of $100 with 5% monthly churn? That's $100 ÷ 0.05 = $2,000. The math isn't hard. Just make sure your time periods match up - monthly ARPU means monthly churn, not annual. I learned that the hard way lol. Some people throw gross margin into the mix too for a better profit picture, but honestly start simple. Get consistent tracking down first. You can always make it fancier later.
So for tracking engagement, start with your basics like MAU and how often people actually open the app. Session length matters too - are they just poking around or really using it? Feature adoption rates are clutch for figuring out what's working (and what's probably dead weight on your roadmap). I'd also watch actions per session and how fast new users hit that "aha moment." Honestly though? A combined engagement score usually beats obsessing over just one metric. MAU plus session frequency is solid foundation, then stack whatever feature-specific stuff makes sense for your product's main thing.
Break down your customers by industry, company size, or region first. Then calculate your CLV to CAC ratios for each group - you're hunting for 3:1 or better. The segments with high lifetime value AND low churn are your goldmine. Also factor in how much those customers typically expand their spending over time (that's often where the real money is). Honestly, the math part is actually pretty satisfying once you get into it. Run this every quarter and throw more marketing dollars at whatever's working. Don't overthink the segmentation - start simple.
Dude, NPS is clutch for SaaS companies. It basically tells you who's gonna stick around vs. who's about to bounce. People scoring 9-10? Those are your goldmine customers - they won't churn and they'll actually tell their friends about you. But the low scorers will cancel AND probably roast you on Twitter if you're unlucky. I'd check it every quarter, but here's the key part everyone misses - always ask WHY they gave that score. The number's cool but the feedback is where you'll find stuff you can actually improve. Plus it gives you a heads up before your revenue starts tanking.
So here's the thing - upselling and cross-selling are honestly game changers for your ARR and retention numbers. Instead of burning cash on new customer acquisition, you're getting more revenue from people who already trust you. Way more efficient. Your customer lifetime value goes up, plus happy customers who see extra value tend to stick around longer. I'd track expansion revenue separately btw - try to get like 20-30% of your growth from existing customers instead of just chasing new signups all the time. It's where most successful SaaS companies really start to take off.
Dude, trial conversion rates are basically your growth engine. More trials converting = more recurring revenue without blowing extra cash on ads. The numbers get wild when you think long-term. Jump from 15% to 20% conversion? That's huge money. Plus higher rates mean you can spend more acquiring customers, so your marketing scales better. I'd track both weekly and watch for patterns - maybe conversions tank after holidays or spike when you release certain features. Actually, onboarding tweaks usually move the needle more than people expect. Worth testing there first.
So cohort analysis is basically grouping customers by signup date and watching how they behave over time. Super useful stuff. Like you might notice March signups stick around way longer than January ones, or that people from certain channels are just more loyal. I always run monthly cohorts for retention and revenue - it's wild how clear the patterns become. Maybe customers who join during big product launches actually churn faster (counterintuitive, right?). Or enterprise clients from Q4 consistently expand around month 6. You'll spot what's broken in your funnel pretty quickly once you start tracking this way.
ChartMogul and ProfitWell are your best bet for SaaS-specific stuff - they actually get subscription metrics right. Mixpanel's great for user behavior tracking. Google Analytics 4 works too but honestly it's kind of a pain for SaaS. You could go fancy with Tableau or Looker if you need custom dashboards, though that might be overkill depending where you're at. Main thing is finding something that plays nice with whatever you're already using - Stripe, your CRM, etc. I'd start simple and then upgrade when things get more complicated. Way easier than trying to build some complex setup from day one.
OpEx is what murders your SaaS margins - all those ongoing costs like salaries, marketing, servers that just keep coming. The brutal part? You spend big upfront to get customers but then wait forever to actually make that money back through subscriptions. I learned this the hard way when I saw companies burning through cash way too fast. Your OpEx should grow slower than revenue, period. Otherwise you're just hemorrhaging money. Check your OpEx as a percentage of revenue each month - anything over 80% consistently means you gotta cut costs or raise prices. No way around it.
Pricing is honestly the biggest lever you have in SaaS. Charge more and your MRR/LTV look great, but conversions tank if people don't see the value. Go too low and you'll need like 3x the customers to hit the same revenue - which sounds easier but trust me, it's not. The real challenge? Finding that price where you make good money per customer without scaring everyone away. I'd definitely test a few different price points with small groups first. Watch how your payback period changes and whether the unit economics actually make sense. Don't just guess on this one.
No Reviews