


Sales Performance Scorecard Dashboard By Different Countries




Try Before you Buy Download Free Sample Product
 Impress Your
 Audience
 100%
100% Editable
 Save Hours
 of Time


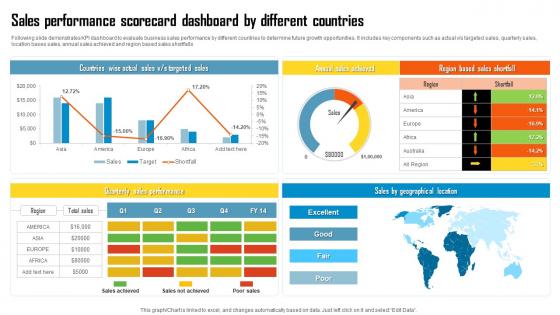
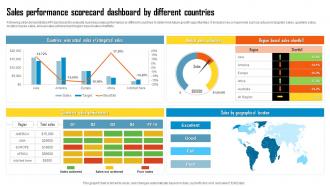
Following slide demonstrates KPI dashboard to evaluate business sales performance by different countries to determine future growth opportunities. It includes key components such as actual v or s targeted sales, quarterly sales, location bases sales, annual sales achieved and region based sales shortfalls.
People who downloaded this PowerPoint presentation also viewed the following :
Sales Performance Scorecard Dashboard By Different Countries with all 7 slides:
Use our Sales Performance Scorecard Dashboard By Different Countries to effectively help you save your valuable time. They are readymade to fit into any presentation structure.





FAQs for Sales Performance Scorecard Dashboard
Track revenue stuff first - monthly sales, conversion rates, deal sizes. Activity metrics matter too since calls and emails actually drive those numbers. Pipeline health is huge - how long deals take to close, lead quality, that kind of thing. Customer retention and upsells if you're handling existing clients. Honestly, I'd stick to maybe 6-8 metrics max because otherwise you end up with this massive dashboard that just sits there collecting digital dust. The whole point is having something you'll actually check regularly, not some overwhelming spreadsheet nightmare.
So a sales scorecard just takes your company's big goals and breaks them into stuff your team can actually measure. Like instead of "make more money," you'd track conversion rates or deal sizes - things that add up to revenue growth. Your reps can see how their work connects to the bigger picture, which honestly makes a huge difference in motivation. Pick maybe 3-5 metrics that tie back to your main goals. The key is making sure everyone gets why each metric matters - otherwise it's just random numbers they'll ignore.
Dude, visual sales scorecards are seriously worth it. Instead of staring at spreadsheet hell, your team gets actual charts they can digest quickly. Heat maps show territory performance at a glance, progress bars make quota tracking way less painful. Trust me, nobody wants to dig through rows of numbers to find problems. Trends and weird outliers just pop out when you graph everything. Your reps will actually know where they stand without doing math. Start simple though - basic bar charts work great. Sometimes I think we overcomplicate this stuff, but dashboards really do speed up those "aha" moments.
Honestly? Weekly's your sweet spot. Most teams do monthly but that feels too slow to me - you miss stuff. I tried daily updates once and my team wanted to murder me lol. Way too much data chaos. Pick weekly and actually stick to it though. Consistency matters more than the exact timing. Set up some automated pulls so you're not stuck doing math every single time - learned that one the hard way too. You'll catch trends fast enough to fix things without driving everyone crazy with constant reporting requests.
Dude, those monthly reports are basically useless - they just tell you what already went wrong. With a scorecard, you're seeing everything in real-time: revenue, pipeline health, activity levels, conversion rates. All on one screen. Think of it like checking your GPS while driving instead of realizing you're lost 20 miles later. Your team can actually track their progress as it happens, not weeks after the fact. Plus the visual setup makes spotting problems way easier. Oh, and don't go crazy at first - pick like 3-5 metrics and add more later.
Don't just stare at individual numbers - look for patterns instead. Compare your top performers to the ones struggling and see what's actually different. Your best rep might have double the discovery calls but same lead volume, which means they're way better at qualifying. The biggest insights usually come from gaps you wouldn't expect, honestly. Activity metrics and conversion rates between pipeline stages matter more than just revenue - that's where you'll spot the real issues. Then you can coach on specific weak points instead of just telling people to "sell more" (which never works anyway).
Honestly, I'd just start with whatever CRM you're already using - Salesforce, HubSpot, whatever. They've got your data sitting there anyway, so why complicate things? If you need fancier charts and stuff, Tableau or Power BI are pretty solid. Don't sleep on Excel though - I know it sounds basic, but it gets the job done when you're figuring out what actually matters. For live dashboards, Klipfolio's decent (used it at my last company). My take? Pick the path of least resistance first. You can always upgrade once you know which metrics your team actually cares about.
Honestly, scorecards work because nobody can BS their way out of bad numbers when everything's right there in black and white. Your team will definitely step up when they know their performance is getting tracked and compared to everyone else's. Think of it like a fitness tracker but for hitting quota. The trick is being upfront about expectations from day one, then actually reviewing the thing in your team meetings - not just creating it and forgetting about it. Once people realize they'll have to explain why their numbers suck, they magically start caring more about their daily activities.
Focus on three things: teaching them the actual KPIs, how to read the charts and color coding, and - this is the big one - what to actually DO with the data. Most people get stuck on that last part honestly. They'll stare at numbers all day but have no clue what action to take. I'd start with a hands-on workshop using real examples from your scoreboard. Then do follow-up training by role since account managers need different stuff than sales reps. Oh, and definitely include a session showing what good performance looks like so they can compare themselves properly.
Your scorecard shows conversion rates and deal sizes, but it misses the *why* behind everything. Like why Sarah keeps losing deals at the end, or why Mike's prospects all complain about confusing pricing. Reps talk to customers every day - they're catching objections, market changes, and what competitors are doing way before it hits your data. Honestly, most managers ignore this goldmine. Try monthly feedback sessions where reps share what they're actually hearing out there. Then match those insights with your scorecard numbers to find patterns you'd totally miss otherwise.
Honestly, the worst thing you can do is track like 15 different metrics - I've watched teams completely lose sight of what actually matters. Vanity metrics are another trap. Also don't make it so complicated that updating the thing becomes a nightmare nobody wants to deal with. Your sales process isn't the same as Company X, so don't just steal their approach. Start with maybe 3-5 metrics that actually connect to revenue. Short sentences work better than long ones here. You can always layer on more stuff once the basics are humming along, but seriously - keep it dead simple at first.
Just swap out metrics for what actually works in your situation. Transactional sales? Track calls and conversion rates. Complex B2B needs pipeline stuff and relationship metrics instead. Your industry changes everything too - SaaS companies care about MRR and churn, but manufacturing focuses on deal size. I swear, most teams just grab random templates and then can't figure out why their scorecard sucks. Look at your specific sales cycle touchpoints first. Then build KPIs around the moments that actually predict whether you'll hit your numbers or not.
Honestly, good goal-setting changes everything for team energy. Your people need to know what they're actually aiming for - not just wandering around hoping things work out. I've seen teams get this confidence boost when targets feel doable but still push them a bit. Break big goals into smaller chunks so you get those little wins along the way (nothing beats crossing stuff off a list, right?). The tricky part is finding that sweet spot - too easy and people zone out, too brutal and they'll just quit trying. Maybe start by asking your team how they feel about current targets? Are they pumped or totally defeated?
Definitely start with customer satisfaction scores and churn rates - that's where the real story lives. Support ticket data shows you what's actually breaking down too. I'd also grab competitor pricing intel and see which lead sources are actually working (vs just looking busy). Your CRM probably has tons of sales activity patterns you haven't even noticed yet. Marketing campaign results are obvious but honestly overlooked half the time. Oh and product usage metrics - those can predict who's about to bail before they even know it. More data connections = clearer picture of what's driving revenue.
The scorecard gives you crazy specific talking points for coaching sessions. Like if Sarah's crushing lead gen but her close rate sucks, boom - you know exactly what to work on instead of just saying "do better." Track week-to-week progress and actually celebrate when they improve. Here's the thing though - don't be a data dictator about it. Sit down with them and go through the numbers together. Let them tell you what they think is happening. Way more effective than the old "you need to sell more" approach, and honestly it makes these conversations so much easier when you've got real metrics backing everything up.
-
Great product with highly impressive and engaging designs.
-
“Easy to use. I always wanted to have a quick search for products and SlideTeam has helped me have it.”