


Security Information And Event Management Dashboard Siem For Security Analysis




Try Before you Buy Download Free Sample Product
 Impress Your
 Audience
 100%
100% Editable
 Save Hours
 of Time


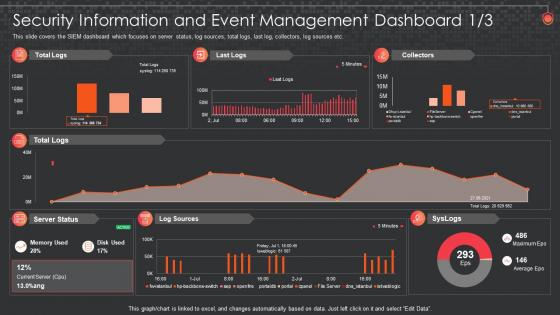
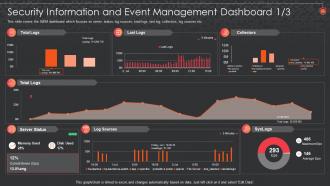
This slide covers the SIEM dashboard which focuses on server status, log sources, total logs, last log, collectors, log sources etc.
People who downloaded this PowerPoint presentation also viewed the following :
Security Information And Event Management Dashboard Siem For Security Analysis with all 7 slides:
Use our Security Information And Event Management Dashboard Siem For Security Analysis to effectively help you save your valuable time. They are readymade to fit into any presentation structure.





FAQs for Security Information And Event Management Dashboard Siem
Start with real-time threat alerts and security event trends - those are your bread and butter. Dashboards for incident response and compliance tracking come next. Network anomalies too, obviously. Different roles need different views though - SOC analysts want the nitty gritty details while execs just want the big picture stuff. Automated threat intel feeds save you tons of manual work. Vulnerability tracking is huge right now. Honestly, the trick is balance. Comprehensive enough to catch everything but not so cluttered you miss the important alerts. Build these core features first, then see what your team actually clicks on daily and expand from there.
Dude, visual dashboards are a game changer for SIEM stuff. You'll spot threats instantly instead of scrolling through endless logs like some kind of masochist. Heat maps and real-time charts make anomalies pop - weird traffic spikes or sketchy login attempts show up in bright red and you can't miss them. What used to take hours buried in raw data now takes minutes. I swear the visual aspect just clicks differently in your brain. Set up dashboards for whatever metrics actually matter in your setup and watch how fast you catch incidents.
Focus on failed logins, weird network traffic, and privilege escalation stuff first. Authentication anomalies and data exfiltration indicators are huge too. The dashboard's gonna look like a Christmas tree at first - so many alerts everywhere! Set proper thresholds or you'll hate your life dealing with false positives. Track your detection and response times because that's how you know if you're actually getting better. Oh, and endpoint security alerts obviously. Start simple with these basics, then add more detailed metrics once your team isn't completely overwhelmed by everything.
UBA basically feeds straight into your SIEM through widgets and correlation rules - you'll spot weird login times, strange data access, privilege escalations mixed in with regular alerts. Pretty slick once you dial it in right. The engine learns what's "normal" for each user, then flags anything sketchy that screams compromised account or insider threat. Focus on high-privilege users first though - that's where you'll catch the really bad stuff. Oh and don't expect it to work perfectly out of the box, took us like a month to get the false positives under control.
Honestly, customizable alerts are what make your SIEM actually worth using instead of just looking pretty. Without them, you're either missing real threats or getting buried under pointless notifications - been there, it sucks. Set thresholds that match how your network normally behaves. Like, maybe 50 failed logins is your red flag instead of 5 if you've got tons of traffic. Otherwise you'll go crazy with false alarms or completely miss the bad stuff. I'd start with your most important systems first, then work outward. Way easier than trying to fix everything at once.
Talk to your actual users first - they know what they need way better than management thinks they do. Most SIEM dashboards are honestly a hot mess of clutter. Put the critical stuff front and center where people can't miss it. Group things logically and don't go crazy with fancy charts that look cool but tell you nothing useful. I'd set up monthly feedback sessions so users can complain about what's not working. Oh, and test changes with like 2-3 people before you roll it out to everyone and potentially break their workflow.
Dude, biggest thing I see? People cram way too much stuff on one screen - it's like visual overload. Also stop obsessing over vanity metrics that look cool but tell you nothing useful about actual threats. Make sure you're using color and sizing smartly so the important stuff actually pops. Honestly, half these dashboards need an engineering degree just to read them. Your executives want totally different info than your SOC team does. Pick your most critical stuff first and build from there. Don't try to solve everything at once - you'll just end up with a hot mess.
So basically, real-time feeds turn your SIEM from this boring static thing into something actually useful. You'll see threats happening right now instead of finding out hours later when it's too late. Think of it like live radar vs yesterday's weather report - which one helps when a storm's coming? Anomalies show up immediately, you can connect the dots between events, and actually respond while stuff is still going down. Honestly, batch updates are pretty much useless for security nowadays. Just make sure you set up proper alerts though, because nobody wants to babysit dashboards all day.
Historical data is huge for this stuff. You need that baseline to tell real threats from regular background noise - otherwise everything looks terrifying! I'd say get at least 30-90 days of clean data before you trust your detection rules. You'll start seeing patterns and seasonal trends in user behavior. Plus it shows whether your security is actually getting better over time or if certain attacks are ramping up. Honestly, trying to do anomaly detection without historical context is like diagnosing someone's health from a single snapshot.
So ML in your SIEM basically spots weird stuff automatically - network traffic, user behavior, system logs, all that. It learns what's normal for your setup, then alerts you when something's off. Honestly game-changing since there's no way you'd catch this manually. The cool part? It connects random events that seem unrelated but are actually part of bigger attacks. Your team stops wasting time on false alarms too since it prioritizes real threats. Oh and start with user behavior analytics first - way easier to wrap your head around than jumping into the deep end.
Start with whatever compliance stuff you actually need to hit - everything else flows from there. Your dashboard widgets should map straight to audit controls like access management, data integrity, response times. Auditors are the worst when they have to dig through random security metrics, so group related compliance data together. Daily/monthly/quarterly views work best. Make sure you can drill down into the supporting evidence too. Automated alerts for violations will save your butt during audit season - trust me on this one. Oh, and definitely test it with real compliance scenarios before you're in crunch mode.
SIEM dashboards totally depend on what scares your industry most. Banks obsess over transaction monitoring and fraud widgets. Healthcare? They're all about patient data access and HIPAA stuff. Retail lives in fear of credit card breaches, so PCI compliance dashboards are everywhere. Manufacturing and utilities worry about cyber attacks shutting down actual production lines - which honestly sounds terrifying. Government agencies layer on insider threat tracking since they've got classified data moving around. My advice? Figure out your top three nightmare scenarios first, then build your main views around those specific risks.
Dude, automation seriously saves your butt with SIEM dashboards. All that tedious alert correlation and manual investigation? Gone. Set up automated rules to filter out the garbage and escalate real threats - honestly, some teams I know cut investigation time by 70%. Your analysts stop drowning in false positives and can actually think about the tricky cases. Oh, and start with whatever alert types you see most often. Way easier to build from there than trying to automate everything at once.
Real-time or every 5-10 minutes is what you want for SIEM dashboards. Hour-old breach data is basically useless - by then you're already screwed. Critical security stuff needs to update immediately so you can actually do something about threats. Operational metrics that aren't super urgent? Those can refresh every 30 minutes or so without breaking anything. You don't want to kill your system performance chasing updates you won't act on anyway. I'd start with 10-minute refreshes and see how that feels for your team's workflow.
Honestly, most SIEM platforms make this pretty straightforward. Chat widgets and ticket buttons can go right into your dashboard panels. I'd start with whatever communication tool your team actually uses - Slack, Teams, whatever. Set up automated alerts so when thresholds get hit, everyone knows immediately. The real game-changer though? Real-time commenting features. Trust me, explaining those weird anomalies becomes so much easier when you can just annotate directly on the dashboard. Your future self will thank you for not having to jump between fifteen different tools. Build it out gradually based on how your team actually works.
-
Colors used are bright and distinctive.
-
Use of different colors is good. It's simple and attractive.