


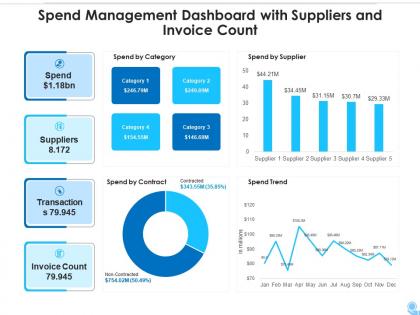
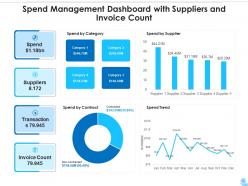
Spend management dashboard with suppliers and invoice count




Try Before you Buy Download Free Sample Product
 Impress Your
 Audience
 100%
100% Editable
 Save Hours
 of Time


Our Spend Management Dashboard With Suppliers And Invoice Count are topically designed to provide an attractive backdrop to any subject. Use them to look like a presentation pro.
People who downloaded this PowerPoint presentation also viewed the following :
Spend management dashboard with suppliers and invoice count with all 2 slides:
Use our Spend Management Dashboard With Suppliers And Invoice Count to effectively help you save your valuable time. They are readymade to fit into any presentation structure.
FAQs for Spend management dashboard with suppliers
Start with the basics: total spend by category and budget vs actual. Track your top suppliers by volume - that's where the big money goes. Monthly recurring spend is huge because creeping costs are sneaky. Payment terms compliance and contract utilization rates are goldmines for insights, honestly. Spend variance trends over time will show you patterns. The trick is balancing the big financial picture with operational details that actually help you decide stuff. Once you nail these core metrics, you can get more specific based on whatever questions keep popping up.
Honestly, visual dashboards are a game changer for tracking spending. Charts and heat maps make trends pop out instantly - way easier than drowning in spreadsheet hell. You can spot seasonal spikes, see which departments are bleeding money, and identify your biggest cost drivers fast. The filtering is clutch too - slice by time, category, whatever you need. I'd start with just a few key reports for your main spending areas first (don't go crazy setting up 20 different views). You'll catch stuff you'd never notice in regular reports. Plus the whole team can actually understand what they're looking at.
Dude, real-time data integration is seriously clutch - you'll spot spending issues the second they happen instead of finding out weeks later when it's too late. No more waiting around for monthly reports while your budget gets destroyed. Those "wtf we spent $3k on what??" moments become way less painful when you catch them early. Plus you can actually negotiate with vendors or move money around when you have fresh data, not stale numbers from last month. Oh, and definitely set up alerts for your main spending buckets. Trust me on this one.
So most platforms let you drag and drop widgets around, which is honestly pretty slick. Start with your top 3-5 spend metrics that actually matter to your business. Healthcare folks usually track medical supply compliance and vendor certs, while manufacturing cares more about raw material costs and lead times. You can set up custom alerts and different views for different roles. Oh, and don't forget you'll probably want to connect your industry-specific data sources too. The workflow automation stuff is where it gets really useful though - saves tons of time once you set it up right.
So predictive analytics is basically like having a heads-up for your spending before things go sideways. It looks at your past data and figures out where you're headed financially - catches budget overruns early, spots weird spending that could be fraud or just wasteful stuff. The dashboard sends alerts when trends show you'll blow past budgets or vendor costs are about to jump. Then you can actually do something about it - renegotiate contracts, move money around, whatever. Way better than the usual panic mode when you're already over budget. Honestly, it's pretty game-changing once you get used to it.
Honestly, these dashboards are game-changers for finding where you're bleeding money. Instead of drowning in spreadsheets, you'll actually see patterns - like paying three different vendors for the same stuff or catching those random spending spikes that make no sense. Real-time budget tracking is clutch too. You can compare vendor prices across purchases and see which departments are going nuts with their spending. I'd start with your biggest expense categories since that's where the real money is. The visual stuff makes it way easier to spot duplicates and weird trends you'd never catch otherwise.
Bar charts and line graphs are gonna be your best friends here - perfect for tracking spending over time and comparing different categories. Pie charts? Sure, they work for budget breakdowns, but honestly they look terrible once you get past like 5-6 categories. Heat maps are actually super useful for spotting patterns across departments or months. Tables are boring but necessary for people who need exact numbers. I'd probably start with a simple dashboard using bars and lines, then add detailed tables underneath. Oh, and don't overthink the design - clean charts usually win.
Honestly, user feedback is what separates dashboards that actually get used from ones that just sit there looking nice. Ask your finance team what they're checking every day - you'll probably be surprised how different it is from what you built. Those daily pain points they mention? That's gold for figuring out what features to build next. I'd throw in some quick surveys right in the interface, or just schedule regular check-ins with heavy users. The stuff they complain about - like hunting for specific filters or getting lost in navigation - reveals blind spots you'd never spot on your own. It's way better than guessing what they need.
Honestly? Data is gonna be your biggest headache. All those different systems - procurement, finance, AP - they're like speaking different languages and nothing syncs up properly. People hate changing how they work too, so expect pushback there. Plus you'll need to convince the higher-ups to actually fund this thing, which... good luck with that. Oh and integration always takes twice as long as they tell you it will. My take? Don't try to boil the ocean right away. Pick one department or maybe just track office supplies first, prove it works, then roll it out everywhere else.
Oh dude, these dashboards are seriously a game changer. They automatically track every transaction and catch stuff that breaks your company policies. Real-time visibility into spending, approvals, all that good stuff - audit season becomes so much less painful. Instead of drowning in spreadsheets for hours, reports get generated instantly. Plus you can set up alerts for when people go over budget or violate policies. Honestly beats finding out about problems three months later. You'll spot issues before they blow up into bigger headaches.
Honestly, having mobile access is a total game changer for staying on top of spending. You can catch budget issues right when they happen instead of finding out days later at your desk. Those push notifications are clutch - I get alerts for weird charges or when someone needs approval, even if I'm stuck in traffic or whatever. Makes the whole approval process way smoother since people don't have to wait around for you to check email. Seriously, just download the app and turn on notifications. Trust me, you'll save yourself so many headaches when you spot that random vendor charge before it spirals.
Honestly, role-based training is where you want to start - finance people need totally different stuff than procurement folks. Cover the basics first: filtering, alerts, reading key metrics. I've watched so many companies mess this up by diving into fancy features too early. Use your actual company data during training, not some boring generic examples. Pick a "champion" from each department to help people afterward - trust me on this one. Oh, and definitely do follow-up sessions like 2-3 weeks later. People will have real questions by then and you'll catch anyone who's still struggling.
Most dashboards connect pretty easily with ERPs like SAP or QuickBooks through APIs or direct database links. File uploads work too if that's all you've got. The data mapping setup is honestly the biggest pain - took us forever to get ours right, but after that it runs smooth. Your IT folks will want automated feeds so you're not constantly uploading stuff manually. Procurement and AP systems usually sync fine too. I'd check what connectors your vendor has first before you dive in. Way easier than trying to force connections that don't exist.
First thing - you absolutely need real-time visibility. Waiting weeks to see where money went is useless. Make sure whatever you pick integrates well with your existing systems, otherwise you'll be manually entering data forever (been there, not fun). The dashboard has to be intuitive too. I've seen companies buy expensive tools that just collect dust because they're too complicated. Solid reporting with custom views is non-negotiable, plus automated alerts when you're hitting budget limits. Oh, and don't skip mobile access - you'll want to approve stuff on the go. Demo a few options that actually solve your current headaches.
Track the obvious stuff first - cost savings, faster processing times, compliance improvements. That's your ROI gold mine. But don't ignore whether people actually use the thing (learned this the hard way with a previous project). Monitor login rates, how often they generate reports, and speed of catching spend issues. Survey your finance folks about decision confidence - that's huge. Honestly, I'd start with maybe 3-4 key metrics instead of going overboard. Get your baseline before launch, then check quarterly. The fancy metrics mean nothing if adoption sucks.
-
Commendable slides with attractive designs. Extremely pleased with the fact that they are easy to modify. Great work!
-
Appreciate the research and its presentable format.