


Supply Chain Management Demand Forecasting Powerpoint Presentation Slides




Try Before you Buy Download Free Sample Product
 Impress Your
 Audience
 100%
100% Editable
 Save Hours
 of Time


Select Supply Chain Management Demand Forecasting PowerPoint Presentation Slides to explain the process of demand planning and forecasting methods. The supply and demand planning PowerPoint complete deck include a set of slides such as planning and forecasting, supply chain management budget forecasting, sales forecasting, demand forecasting, master production planning, etc. All slides are easy to customize. Users can edit these templates as per their requirements. This helps you in making various business decisions like planning the production process, purchasing raw materials, managing funds deciding price, etc. Using this demand chain PPT slides you can also represent related concepts like supply chain, supply network, demand modelling, supply and demand, demand planning and many more. Furthermore, users can showcase the purpose of demand planning and key steps of the statistical forecast with this content ready demand modeling PPT slides. Grab this demand driven supply chain assessment presentation layout to demonstrate SCM strategies. Begin to bond with the best with our supply chain management ppt Presentation Slides. The brilliant get automatically attracted.
People who downloaded this PowerPoint presentation also viewed the following :
Content of this Powerpoint Presentation
Slide 1: This slide introduces Supply Chain Management Demand Forecasting. State your company name and proceed.
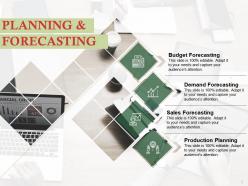
Slide 2: This is Planning & Forecasting slide. It also shows the types of planning and forecasting which are- Production Planning, Budget Forecasting, Demand Forecasting, Sales Forecasting.
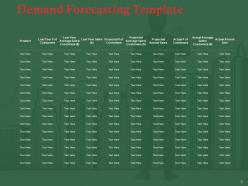
Slide 3: This slide presents Demand Forecasting Template.
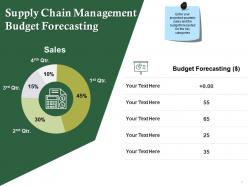
Slide 4: This slide shows Supply Chain Management Budget Forecasting in a pie chart/ graph form. Enter your projected quarterly sales and the budget forecasted for the key categories.
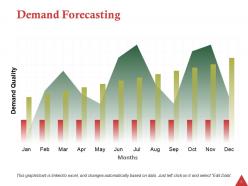
Slide 5: This slide presents Demand Forecasting in a graphical form.
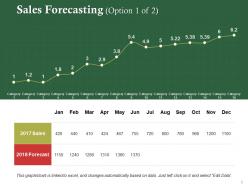
Slide 6: This slide shows two year Sales Forecasting graphically.
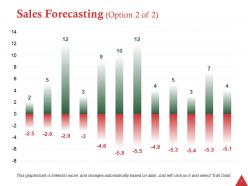
Slide 7: This slide also presents Sales Forecasting in a graphical form.
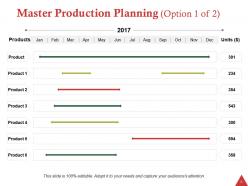
Slide 8: This slide presents a Gantt chart which shows Master Production Planning. Add in several products that your company offers along with monthly data of each of those products.
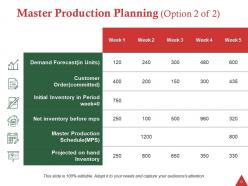
Slide 9: This slide also shows Master Production Planning table in terms of weeks.
Slide 10: This is Supply Chain Management Demand Forecasting Icon Slide. Alter/ modify the icons as per
Slide 11: This slide is titled Additional Slides to move forward. You can change the slide content as per need.
Slide 12: This slide showcases Our Mission. Show your company mission and goals here.
Slide 13: This slide shows Our Awesome Team with images.
Slide 14: This is an About Us slide. State team/ company specifications here.
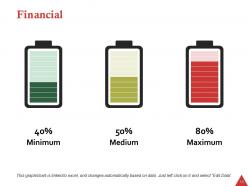
Slide 15: This slide shows Financial score. State financial aspects here.
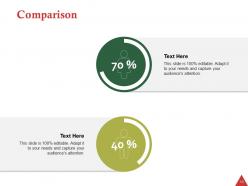
Slide 16: This is a Comparison slide to show comparison of two entities.
Slide 17: This is Our Goal slide. State your goals here.
Slide 18: This is a Quotes slide to convey company/ organization message, beliefs etc. You may change the slide content as per need.
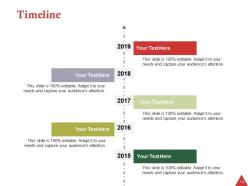
Slide 19: This is a Timeline slide to present important dates, journey, evolution, milestones etc.
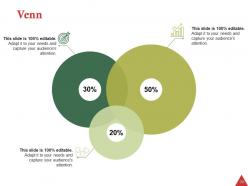
Slide 20: This is a Venn diagram image slide to show information, specifications etc.
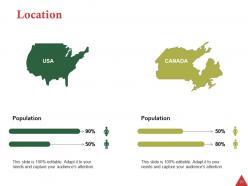
Slide 21: This is a Location slide to show growth, presence etc. with map imagery.
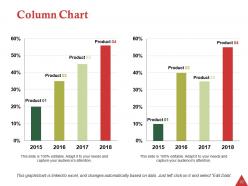
Slide 22: This slide presents a Column Chart for showcasing product/ company growth, comparison etc.
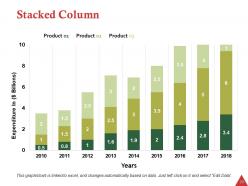
Slide 23: This is a Stacked Column graph slide to show product/ entity comparison, specifications etc.
Slide 24: This is a Thank You slide with Address, Email Address, and Contact Number.
Supply Chain Management Demand Forecasting Powerpoint Presentation Slides with all 24 slides:
Leave a lasting impression with our Supply Chain Management Demand Forecasting Powerpoint Presentation Slides. They possess an inherent longstanding recall factor.
-
Supply Chain Management Demand Forecasting Powerpoint Presentation Slides
-
Supply Chain Management Demand Forecasting Powerpoint Presentation Slides
-
Supply Chain Management Demand Forecasting Powerpoint Presentation Slides
-
Supply Chain Management Demand Forecasting Powerpoint Presentation Slides
-
Supply Chain Management Demand Forecasting Powerpoint Presentation Slides
-
Supply Chain Management Demand Forecasting Powerpoint Presentation Slides
-
Supply Chain Management Demand Forecasting Powerpoint Presentation Slides
-
Supply Chain Management Demand Forecasting Powerpoint Presentation Slides
-
Supply Chain Management Demand Forecasting Powerpoint Presentation Slides
-
Supply Chain Management Demand Forecasting Powerpoint Presentation Slides
-

Supply Chain Management Demand Forecasting Powerpoint Presentation Slides
-

Supply Chain Management Demand Forecasting Powerpoint Presentation Slides
-

Supply Chain Management Demand Forecasting Powerpoint Presentation Slides
-

Supply Chain Management Demand Forecasting Powerpoint Presentation Slides
-
Supply Chain Management Demand Forecasting Powerpoint Presentation Slides
-
Supply Chain Management Demand Forecasting Powerpoint Presentation Slides
-
Supply Chain Management Demand Forecasting Powerpoint Presentation Slides
-
Supply Chain Management Demand Forecasting Powerpoint Presentation Slides
-
Supply Chain Management Demand Forecasting Powerpoint Presentation Slides
-
Supply Chain Management Demand Forecasting Powerpoint Presentation Slides
-
Supply Chain Management Demand Forecasting Powerpoint Presentation Slides
-
Supply Chain Management Demand Forecasting Powerpoint Presentation Slides
-
Supply Chain Management Demand Forecasting Powerpoint Presentation Slides
-

Supply Chain Management Demand Forecasting Powerpoint Presentation Slides
FAQs for Supply Chain Management Demand Forecasting
Honestly, it all comes down to your data quality first - if it's messy or too recent, you're screwed from the start. Seasonality is huge too, obviously. External stuff like economic shifts or what competitors are doing can totally throw off your predictions. Some industries are just easier to forecast than others - utilities vs fashion, night and day difference. Established markets beat emerging ones every time for predictability. Oh, and B2B customers are way more predictable than regular consumers since they actually plan their purchases. Figure out where your industry sits first, then zero in on whatever actually drives your demand patterns.
So first thing - clean up your historical data. Toss the outliers, fill in gaps, and account for weird stuff like promotions or supply issues. Look for patterns across different timeframes: seasonal trends, growth patterns, cycles. Honestly, crappy data just gives you crappy forecasts, so don't skip this part. Try statistical models like moving averages for steady demand or exponential smoothing when things are trending. Test a few different approaches and check how accurate they are against data you hold back. Start basic with trend analysis before getting fancy with complex algorithms.
So basically, you need to look at what's happening in the economy to predict if people will actually buy your stuff. Track GDP, unemployment, consumer confidence - that kind of thing. When the economy tanks, people stop buying random crap they don't need. Look back at your sales data from the past couple years and see which economic factors lined up with your good/bad months. Honestly, most companies ignore this and wonder why their forecasts are garbage. Pick 2-3 indicators that actually matter for your industry and work them into your predictions. It's like having a crystal ball, but with actual data.
Honestly, ML is pretty amazing for demand forecasting. It picks up on weird patterns that basic stats just can't handle. You know how traditional methods need you to manually adjust everything? ML algorithms actually learn from multiple factors at once - seasonality, promos, weather, whatever's happening with competitors. The cool part is they adapt automatically when market conditions shift. You can even feed in random stuff like social media buzz or economic data that would take forever to analyze manually. Oh, and definitely test it on your most unpredictable products first - that's where you'll see the biggest wins.
Honestly, you're gonna hit three big walls: crappy data, markets going nuts, and seasonal stuff messing everything up. Bad historical data is the absolute worst - like trying to bake with spoiled ingredients, right? Clean up your data collection first, that's where you'll see the biggest wins. Build multiple scenarios instead of betting everything on one forecast. I learned this the hard way last year. For seasonal patterns, throw in holidays, promos, economic stuff - whatever actually moves your numbers. Start by figuring out which data sources suck the most and fix those first.
Dude, consumer behavior data is where it's at for forecasting. Website clicks, social media stuff, search patterns - way better than just looking at old sales numbers. Honestly, clickstream data is like having a crystal ball. Check out how people browse before they buy, when they're most active, how they react to deals. You'll spot trends weeks before they show up in actual sales. Oh and seasonal patterns are huge too - people's buying habits are so predictable once you map them out. Just connect your Google Analytics to whatever forecasting tool you're using. Even basic web data gives you a massive head start on predicting what's coming.
Definitely start with seasonal decomposition - it's like the easiest way to see what's actually happening with your data. Breaks everything into trend, seasonal, and random noise components. From there, Holt-Winters exponential smoothing is solid because it handles seasonality automatically (honestly wish I'd learned this one earlier). ARIMA models work great too but they're kind of a pain to configure. If your data's all over the place, random forests might catch weird non-linear patterns that traditional methods miss. But yeah, decomposition first - gives you the quick wins before diving into anything fancy.
Your suppliers know stuff you don't - like their actual capacity limits and when raw materials might run short. Getting them to share that intel can totally transform your forecasts. Instead of just guessing what you'll sell, you'll know what's actually possible to deliver. Honestly, most companies wait way too long to start doing this. Set up monthly calls with your biggest 3-5 suppliers where you swap info - you share demand signals, they share supply realities. It's one of those simple fixes that makes you wonder why you didn't try it earlier.
Look, when your demand forecasting is off, it's like you can't win either way. Forecast too high? You're stuck with mountains of inventory eating up your cash and storage space - plus stuff expires and goes to waste. Too low and you're constantly running out of products, losing sales left and right. Your customers get annoyed and honestly, who can blame them for going elsewhere? Both situations are terrible for your profits. I'd say focus on getting better data and maybe look into some decent forecasting software. Trust me, the upfront investment beats dealing with this mess constantly.
Dude, cultural stuff will absolutely wreck your forecasts if you're not careful. What's hot in the US might totally bomb in Japan - even basic things like color choices matter way more than you'd think. I learned that lesson the expensive way lol. Regional holidays, shopping habits, seasonal trends... it all varies like crazy. You can't just copy-paste one model everywhere. Build separate models for each region instead. Start small with pilot tests to see if your assumptions actually hold up, then use local data sources. Trust me, the extra work upfront saves you from major headaches later when you're trying to figure out why sales tanked.
For big companies, SAP IBP and Oracle Demantra are solid picks - though honestly they're overkill for most situations. Mid-size businesses do great with Power BI or Tableau. Forecast Pro's pretty specialized but works well too. Look for automated statistical modeling and seasonal adjustments (nobody has time for manual spreadsheet uploads every week). Multiple forecasting methods help you compare what's actually working. Machine learning stuff is nice but not always necessary. Map out your data sources first, then demo maybe 2-3 options that fit your budget. Don't overcomplicate it.
Honestly, you've gotta use both together instead of picking sides. Build your long-term predictions first as your base, then layer on short-term stuff like moving averages to catch those day-to-day swings. Set up check-ins monthly or quarterly where you compare what actually happened vs what you predicted. Most teams I know get super stubborn about their method - big mistake. Your short-term data should challenge those bigger assumptions, while long-term trends help guide immediate decisions. Oh, and definitely set up dashboards showing both timeframes. Makes it way easier to spot when things are going sideways.
For demand forecasting, I'd focus on forecast accuracy first - basically how close you got to actual demand. MAPE is super straightforward since it's just a percentage of how far off you were. Then there's bias (are you always over or under-forecasting?) and forecast value added. Honestly, inventory turnover and stockout rates matter more than the fancy math though - they show if your forecasts actually work in practice. Oh, and set up some kind of monthly tracking so you can catch problems before they snowball. The dashboard doesn't need to be perfect right away.
So basically you want to create multiple forecast models for different "what if" scenarios - economic crashes, supply issues, competitors doing something crazy. Don't just rely on one baseline prediction. Build out optimistic, pessimistic, and most likely cases with clear assumptions for each. Then run your demand models through all these scenarios to see how volumes change. I'd honestly focus on your top 3-4 biggest business risks first - that's where you'll get the most bang for your buck. You can weight them by probability and blend into one stronger forecast. Way more useful than just looking at historical trends.
Dude, charts and graphs are your best friend here - nobody wants to dig through spreadsheets. Always show confidence ranges, not just one perfect number (learned that when sales totally lost it over missed targets lol). Break down your assumptions clearly and flag any big changes from last time. Here's the thing though - executives just want the big picture while ops teams need all the nitty-gritty details. You'll save yourself so much headache if you set up regular check-ins instead of dropping forecasts like bombshells. Oh, and don't overthink the presentation format too much.
No Reviews