



 0 Comment
 Customer Reviews

Henry Ford’s assembly line invention in 1913 is often cited as one of the most pivotal moments in industrial history. It counts right up there with ‘E=mc²’ in physics or ‘The mitochondria is the powerhouse of the cell’ in biology. It revolutionized not just how cars were built, but how global industries approached productivity, efficiency, and scaling.
Fast forward to 2025, and the automotive industry is still number-driven — but now it’s digital dashboards and AI-powered analytics doing the heavy lifting. The global automotive market is expected to rev up to $6.9 trillion by 2030, thanks to the surging demand for electric vehicles, autonomous tech, and connected services. Here’s a stat that might surprise you: over 72% of automotive executives rank operational KPIs as their most valuable strategic asset in navigating this fast-evolving landscape.
Why? This is because today’s automakers must track an ‘assembly line’ of metrics — from inventory turnover ratios to warranty claim rates, production cycle times, and customer satisfaction indexes. And the companies that do it well? They’re seeing a boost in operational performance and a cut in production costs, according to McKinsey’s latest report.
Want a template to create your own KPI Report? Check-out our blog on “Top 10 KPI Report Templates with Samples and Examples.”
To help you keep pace in this numbers-driven arena, we bring you Top 10 KPI in Automotive Industry Templates with Examples and Samples. These PowerPoint decks are designed to make it easy for you to visualize, track, and analyze performance metrics that matter most in automotive operations.
They’re clean, content-ready, 100% editable and customizable, and packed with industry-relevant insights — saving you hours of work. Looking for a template to create KPI for your Product-launch? Then check-out our blog on “Product Launch KPI Templates.”
Let’s now tour these 10 exceptional KPI templates designed for the modern automotive industry.
Template 1: Automotive Industry KPI PPT Template Bundles
Use this PPT Template Bundle to enhance your presentation. It covers metrics of on-time delivery rates, inventory turnover, scrap and reject rates, supplier quality scores, and average result area ratings. Dashboards displaying mechanical team performance provide averages as well as individual scores. Manufacturing performance slides including manufacturing volume, order volume, causes of downtime, top items, and return reasons. Among fleet tracking tools are trips, mileage, live status, activity totals, and speeding incidents. Supply chain KPIs are delivery accuracy, ASN performance, supplier collaboration, sales, costs, on-time delivery, and receivables. In sustainable manufacturing, KPIs address social, environmental, and governmental facets.

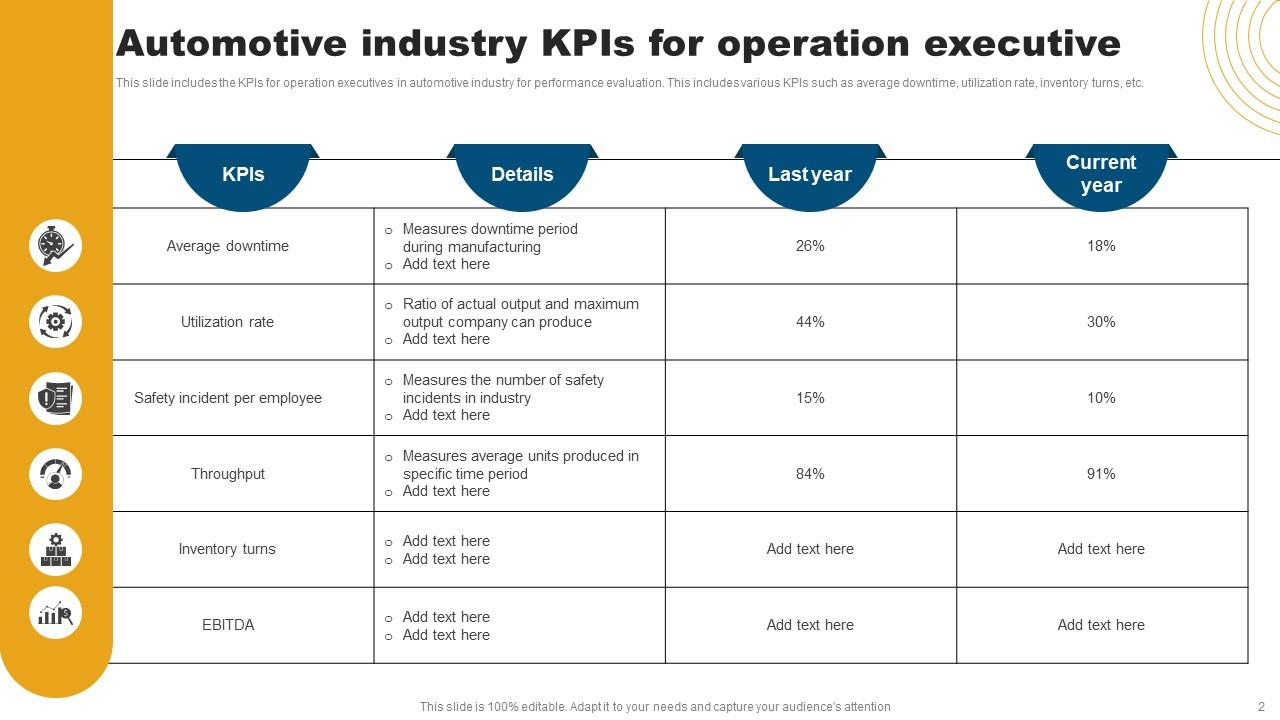
Template 2: Automotive Industry KPIs for Operation Executive PPT Template
This PowerPoint provides significant performance indicators for those in the automotive industry running operations. The slide takes note of six KPIs in total: average downtime, utilization rate, safety event per employee, throughput, inventory turns, and EBITDA. Reflecting the duration of time lost during manufacturing, average downtime last year shows 26% and this year is 18%. Reported as 44% last year and 30% this year, the utilization rate is the actual output divided by maximum possible output. Safety events are tallied by staff counts; last year at 15% and this year at 10%. Throughput shows average units produced from 84% last year to 91% this year. Included also are inventory turns and EBITDA fields.
Template 3: Automotive Industry KPIs for Production Evaluation PPT Template
Important production KPIs for automobile sector performance evaluation are shown in this presentation. It addresses units produced, total manufacturing cost, production cycle time, recall rates, and scrap rate. Calculations based on annual, quarterly, or monthly data are listed to help decision-makers identify underproduction or oversupply; total units produced record the number of vehicles manufactured over a certain period. To evaluate production efficiency, total manufacturing cost measures—including labor, overhead, and material costs—used to represent total investment in production. Measuring the length to complete one vehicle from start to finish on the line, production cycle time aids in tracking manufacturing speed. Included for monitoring are also recall rates and scrap rate measures.

Template 4: Automotive Industry KPI to Analyze Market Competition PPT Template
Use the KPIs shown on this slide to evaluate automotive sector market competitiveness. It covers inventory control, sales, gross profit, EBITDA, accounts payable and receivable. With Company 1 at USD 158 billion, Company 2 at USD 196 billion, and Company 3 at USD 205 billion, sales point to areas of profit generating and opportunities for development. With Company 1 at USD 102 billion, Company 2 at USD 155 billion, and Company 3 at USD 175 billion, gross profit reveals overall profit. Reported as USD 90 billion, USD 100 billion, and USD 96 billion, EBITDA gauges earnings before tax, amortization, interest, and depreciation. Included are data on inventory control and financial status.

Template 5: Performance Evaluation KPI Dashboard for Automotive Industry PPT Template
Key operational indicators from January 1, 2023, till December 31, 2023 show on this performance review KPI dashboard for the automotive sector. It showcases nearly 83% of production efficiency and monthly metrics of inventory turns alongside average inventory value trends. For automotive activities, cycle time comes recorded at 2. Whereas scrap and reject rates are tracked against a 2% benchmark, on-time delivery rates are compared against averages for every month. Listing average supplier quality score at 94.53%, Energy use comes out to be 4,19.00. These measures offer quantitative values in operational, supplier, and energy-related performance spheres.

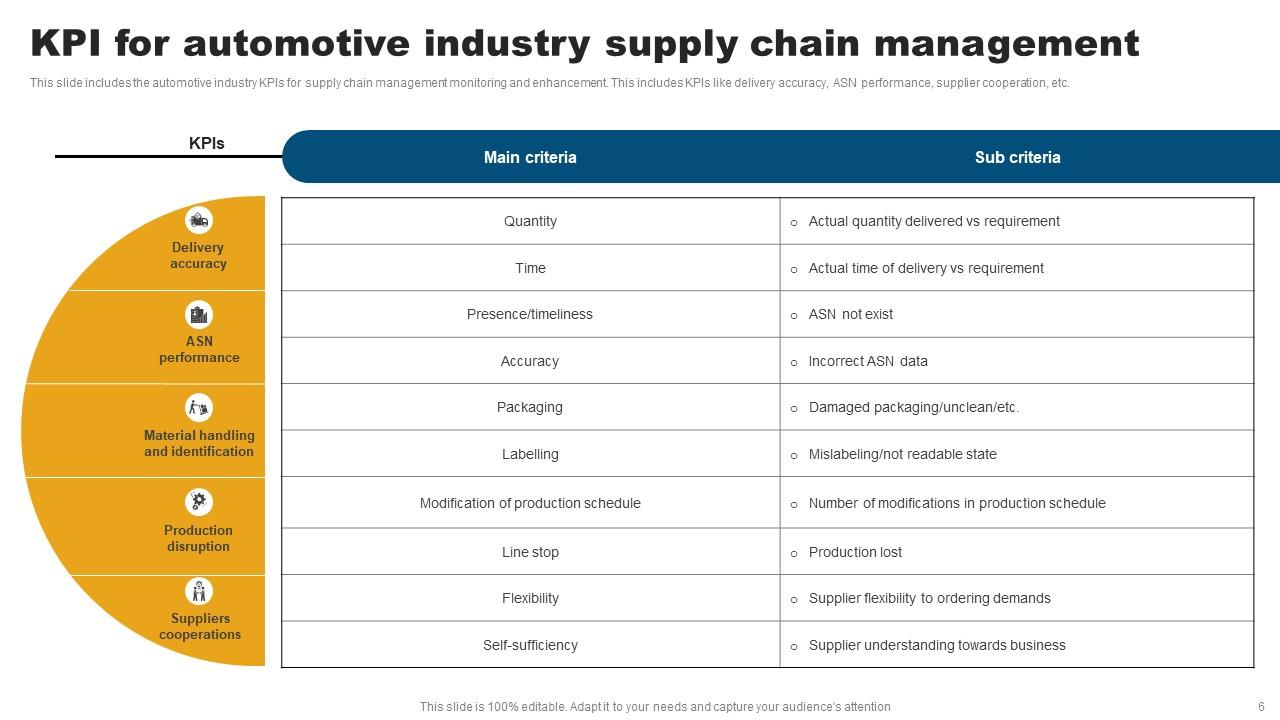
Template 6: KPI for Automotive Industry Supply Chain Management PPT Template
The KPI system for supply chain management in the automotive sector monitors five key categories: delivery accuracy, ASN (Advance Shipping Notice) performance, material handling and identification, production interruptions, and supplier cooperation. Delivery accuracy compares actual deliveries to requirements in terms of timing and quantity, while ASN performance focuses on the accuracy and completeness of shipping notices, highlighting any missing or erroneous data. Material handling and identification track labeling issues, including damaged or unreadable labels and package quality concerns. Monitoring production interruptions helps identify changes in schedules and line stops that can cause production loss, allowing for preventive measures. Lastly, supplier cooperation involves assessing self-sufficiency and adaptability in meeting ordering requirements, informed by an understanding of operational business needs.
Template 7: Automotive Industries KPIs for Service Department Performance Appraisals PPT Template
This KPI set for automotive service department performance appraisal includes four indicators. The first one is effective labor rate, which measures the total revenue generated per billed labor hour, calculated by dividing total sales by total labor billed hours, with a standard of $ 1,000 US. Hours sold per repair order assesses efficiency by dividing the total number of repair orders by the number of service advisors, with a benchmark of 2.3 hours per repair. Client satisfaction and retention are measured by the customer repurchase rate, ensuring clear communication throughout the repair process, with a target of 86%. Fixed coverage measures the operation’s ability to cover dealership overhead expenses, which requires additional definition of standards.

Template 8: Sustainable Manufacturing KPIs for EV Automotive Industry PPT Template
ESG approach categories guide this KPI system for sustainable manufacturing in the EV car sector. Under Environmental, it covers assessing NO and SO2 emissions, with a placeholder for another KPI, and the deployment of renewable energy. Tracking product safety and health, restructuring-related employment reallocation, and a third KPI space, the Social category also records Measuring political party contributions, research and development expenses and includes an open KPI field. The Governance category evaluates these factors. While allowing the opportunity for tailored indicators in every category, this framework addresses performance tracking through environmental metrics, social responsibility measures, and government funding commitments.

Template 9: KPIs Monitoring Logistics in Automotive Industry PPT Template
This KPI monitoring system arranges measurements based on five operational bases under the automotive logistics sector. Under cost, it records third-party transportation costs; logistics costs per vehicle, and a customizable KPI. Among the quality metrics are damaged containers, vehicles out of alignment, and a placeholder KPI. Delivery tracks open KPI slots, weekly and monthly proportion of allocated orders. World-class logistics measures a configurable KPI, logistic pillar level, and standard implementation index. Human resources logs an extra open metric, suggestions per individual, and total absenteeism rate. For controlled performance monitoring, all KPIs are tracked three times quarterly.

Template 10: Global Sales Evaluation KPI Dashboard for Automotive Industry PPT Template
This global sales evaluation KPI dashboard for the automotive industry presents key metrics of total sales, profit, and units sold. The average price per unit has varied from $25.68 to $39.62. Sales by country are ranked, with France, Belgium, and Spain identified as the top markets. The comparison between store sales and online sales indicates a greater share of online transactions. Additionally, new customer acquisition is recorded, with a total value of $5,800, and a chart illustrates the number of customers over time. Overall, the dashboard consolidates financial performance, market distribution, sales channels, and customer growth data for structured business analysis and reporting.

Steering Growth: Automotive KPI Dashboards That Shift Your Business Forward
This dashboard provides a structured framework for tracking operational, financial, production, and market performance metrics relevant to modern automotive businesses. These templates cover production cycle times, on-time delivery, supplier quality, logistics costs, sustainable manufacturing indicators, and sales evaluation dashboards. Each template is designed to monitor and report quantitative values essential for decision-making, operational efficiency, and market competitiveness. By integrating these templates into business processes, automotive companies assess performance, identify gaps, and align operational goals with evolving industry demands in a data-driven environment.
PS: Take a look at our “Top 10 Automotive Industry Business Model Templates With Examples and Samples.”
Automotive Industry FAQs
What is KPI in automotive?
In the automotive industry, a Key Performance Indicator (KPI) is a measurable value that enables companies to track critical aspects of their operations, including production efficiency, quality control, delivery times, and sales performance. These KPIs enable automotive businesses to evaluate progress, identify bottlenecks, and drive improvements.
What is KRA in the automotive industry?
Key Result Areas (KRAs) in the automotive industry define the core responsibilities and focus areas for individuals or teams that directly impact business objectives. KRAs help align daily tasks with strategic goals, ensuring that departments like manufacturing, supply chain, and sales concentrate on outcomes that matter most to the company’s success.
What is KPI in the manufacturing industry?
In manufacturing, KPIs are specific metrics that monitor production processes, operational efficiency, quality standards, and cost management. These indicators offer valuable insights that enable manufacturers to optimize workflows, minimize waste, maintain product consistency, and effectively meet customer demands.