

Budget Variance Analysis Powerpoint Presentation Slides




Try Before you Buy Download Free Sample Product
 Impress Your
 Audience
 100%
100% Editable
 Save Hours
 of Time


Maintain control over the business with our content ready Budget Variance Analysis PowerPoint Presentation Slides. The professionally designed finance budgeting PowerPoint complete deck comprises of self-explanatory templates such as actual cost vs budget, month-wise forecasting, overhead cost analysis, quarterly budget analysis, variance analysis, actual vs target variance, budget vs plan vs forecast, forecast, and projection, etc. Determine the difference between budgeted numbers and actual results using the topic-specific budget projection PowerPoint presentation. Budget variance analysis helps to identify the root cause of the difference in figures. Utilize the self-explanatory actual vs budget variance PowerPoint templates to exercise cost control and cost reduction. Furthermore, you can also use this visually appealing budget vs. actual variance analysis presentation deck to understand why fluctuation happens and showcase ways to reduce the adverse variance. Therefore, download the high quality and visually appealing financial forecasting PowerPoint presentation to meet your planned financial goals. No assignment is a burden for our budget presentation Slides. They are designed for heavy duty.
People who downloaded this PowerPoint presentation also viewed the following :
Content of this Powerpoint Presentation
Slide 1: This slide introduces Budget Variance Analysis. State Your Company Name and begin.
Slide 2: This slide shows Actual Cost vs Budget in tabular form.
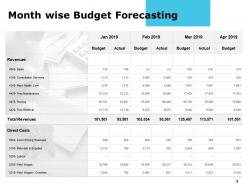
Slide 3: This slide presents Month Wise Budget Forecasting.
Slide 4: This slide displays Overhead Cost Budget Analysis.
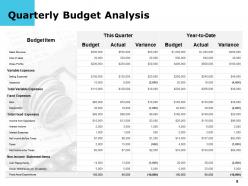
Slide 5: This slide represents Quarterly Budget Analysis in tabular form.
Slide 6: This slide showcases Master Budget vs Actual: Variance Analysis with variable and fixed costs.
Slide 7: This slide shows Actual vs Budget Analysis with categories as original budget, variable cost per unit and flexible budget.
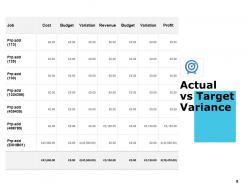
Slide 8: This slide presents Actual vs Target Variance.
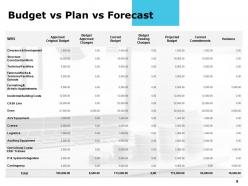
Slide 9: This slide displays Budget vs Plan vs Forecast. You can add data as per requirements.
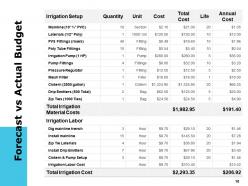
Slide 10: This slide represents Forecast vs Actual Budget.
Slide 11: This slide showcases Forecast and Projection on monthly basis.
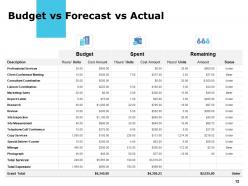
Slide 12: This slide shows Budget vs Forecast vs Actual.
Slide 13: This slide displays icons for Budget Variance Analysis.
Slide 14: This slide is titled as Additional Slides for moving forward.
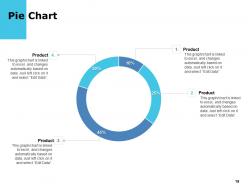
Slide 15: This slide displays Pie Chart with data in percentage.
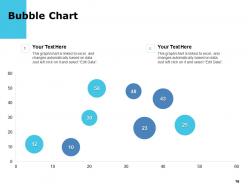
Slide 16: This slide showcases Bubble Chart. You can change data as per requirements.
Slide 17: This is Meet Our Team slide with names and designation.
Slide 18: This is an Idea Generation slide to state a new idea or highlight information, specifications etc.
Slide 19: This is a Puzzle slide with text boxes.
Slide 20: This is a Thank You slide with address, contact numbers and email address.
Budget Variance Analysis Powerpoint Presentation Slides with all 20 slides:
Use our Budget Variance Analysis Powerpoint Presentation Slides to effectively help you save your valuable time. They are readymade to fit into any presentation structure.










FAQs for Budget Variance Analysis
Focus on comparing your actual numbers to what you budgeted, then calculate the variances. Sort them into favorable vs unfavorable - pretty straightforward stuff. Don't waste time chasing every little $50 difference though, that's honestly just busy work. Look for the big variances that actually matter and dig into why they happened. Is it a one-time thing or part of a bigger pattern? Check both your revenue and expense sides. Oh, and write this stuff down somewhere - you'll thank yourself later when you're putting together next quarter's budget and can't remember what went wrong.
So I always do my budget review in that first week after the month closes - once all the numbers are actually in. Just make a basic report showing budget vs what really happened, with the percentage differences for each category. Honestly, I only worry about the big stuff first (anything over 10% off). Then figure out what caused those bigger swings. Don't waste time on every little variance though - you'll drive yourself crazy! The whole point is making it a regular thing and then actually using what you learn to tweak your future budgets and spending.
Market shifts are usually the biggest culprit - your sales team gets blindsided by new competition or economic weirdness. Supply chain disasters love to mess with your costs too, plus those random equipment breakdowns that always happen at the worst time. Sometimes though? The budget was just way too rosy from the start - I've definitely been guilty of that. Volume drops hit hard when demand suddenly tanks. Oh, and check your numbers monthly instead of waiting till quarter-end. Trust me, catching these early saves so much stress later.
So budget variances are basically your company telling you where you guessed wrong - which is actually super useful for planning ahead. Look for patterns in the variances because they'll show you stuff about market conditions or how efficient your operations really are. Honestly, most people just glance at these numbers and move on, but they're missing out. Those variances are telling a story about what's actually happening vs what you thought would happen. Use that intel to shift priorities or move resources around. Sometimes you'll even need to completely change direction based on what you're seeing.
For basic stuff, just use Excel or Google Sheets - they've got the formulas built in and honestly work great for smaller budgets. If things get more complex, look into Adaptive Insights or Planful. QuickBooks works too if you're already using it. I swear I've watched people blow way too much money on fancy software when a simple spreadsheet would've been fine. Start with whatever you already have access to, then only upgrade if you're drowning in calculations. The trick is matching the tool to how complicated your data actually is and what your team can handle.
Honestly, start with monthly - that's usually the sweet spot. Daily stuff gets way too noisy and you'll drive yourself crazy. Weekly can work if things are moving super fast in your business or you're in one of those volatile industries. I've watched teams burn out doing it too often though, just checking boxes without really thinking. The real question is how quickly your budget can derail. If you're launching new products or dealing with crazy market swings, maybe bump it up to weekly. But monthly gives you enough data to actually see patterns. You can always adjust once you figure out if catching problems earlier would actually help you fix them faster.
Budget variance analysis? Oh totally - it's super useful for spotting trends, though don't expect it to predict everything perfectly. I'd look at patterns over 2-3 years rather than getting hung up on month-to-month stuff. You'll start noticing things like seasonal dips or those annoying cost overruns that happen every Q4. The recurring patterns are gold. Just don't rely on it alone - past performance doesn't always mean future results, obviously. Combine it with other forecasting methods too. Honestly, treat it more like a really solid compass than some magic crystal ball situation.
Oh man, this is huge - you've gotta make people feel safe reporting bad news early. Trust me, I've watched teams hide problems until they exploded because everyone was scared of getting blamed. Weekly check-ins work great for catching stuff before it spirals. Frame it as "what can we learn" instead of "who screwed up." People will actually tell you when budgets are going sideways if they know you won't lose it on them. Honestly, the teams that talk openly about their numbers are always the ones that stay on track. Make early reporting feel like a win, not a confession.
Yeah, external stuff can completely wreck your budget - like inflation hitting out of nowhere or supply chains going haywire. Currency changes mess with you too, plus competitors doing random things you didn't see coming. Regulatory shifts are honestly the worst because there's zero warning sometimes. You can't predict this stuff when you're building budgets, which is why those "what the hell happened" moments occur. Track what's internal vs external so you know where the chaos actually came from. Maybe pad your contingency funds more next time?
Honestly, tell the story first - don't just dump numbers on them. Lead with what actually matters and why they should care. Charts are your friend here because spreadsheets make people's eyes glaze over (learned this the hard way). Group similar stuff together so you're not all over the place. Explain what went wrong AND what you're doing to fix it. The thing is, executives get cranky when they don't understand the "so what" part. Come with real next steps and deadlines. They want actionable stuff they can actually work with, not just a data download.
Ok so favorable variances = when you do better than expected. Higher revenue or lower costs than budgeted. Unfavorable is the reverse - less revenue or higher costs. Here's what trips people up though: "favorable" doesn't mean the number is positive! Say you budgeted $100k for expenses but only spent $80k. That's a $20k favorable variance even though the math shows it as negative. Kinda backwards, right? Honestly, I just focus on the business impact first. Did we save money or make more? Then figure out if it's technically positive or negative later.
Look at both percentage and dollar amounts - a 20% variance hits way different on a $1000 line versus $100k, you know? I'd set threshold alerts, maybe 5% for critical stuff and 10% for everything else. Track cumulative variances too since they pile up throughout the year. The real trick is figuring out if it's a one-time thing or part of a bigger pattern. Honestly, the trend analysis over multiple periods tells you more than any single month. Just make sure you can investigate quickly when those thresholds get hit.
Yeah, so manufacturing companies are totally obsessed with material and labor variances - makes sense since those costs destroy profits. Service businesses? They're more about revenue per employee and how much they're actually using their staff. Retail gets crazy tracking sales mix because did you sell the cheap stuff or expensive stuff, you know? Tech companies have this weird thing with R&D variances since nobody can predict when innovation will actually happen (or cost). Healthcare tracks patient volumes like hawks. Honestly, just pick the 2-3 variance types that actually move the needle for your industry's money makers. Don't waste time analyzing everything else.
Honestly, variance analysis is like having a report card for everyone's budget skills. You'll spot who consistently goes over or under, plus figure out if it's bad planning or just stuff they couldn't control. Don't just look at the numbers though - dig into the why during reviews. Perfect for spotting training gaps and recognizing your best cost managers. Oh, and definitely don't blame people for crazy external factors messing up their budgets (learned that one the hard way). Use it to set better goals that actually make sense for each person.
Oh man, this is such a real thing! Teams in some cultures see missing budget as personal shame, so they'll sugarcoat bad news or just avoid reporting it altogether. Others are way more chill about it - they treat budget talks like brainstorming sessions. Hierarchy plays a huge role too. Some groups won't dare challenge unrealistic numbers from management, while others will straight-up argue. I've seen this mess up so many variance analyses honestly. When you're looking at international numbers, don't take anything at face value. The cultural backdrop matters more than people think.
-
Enough space for editing and adding your own content.
-
Out of the box and creative design.
-
Awesomely designed templates, Easy to understand.
-
Great experience, I would definitely use your services further.