

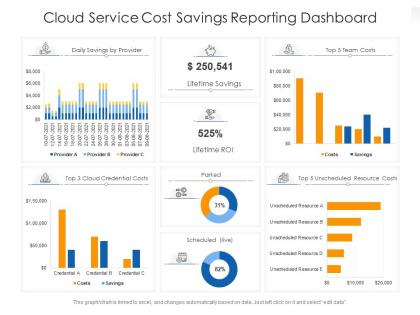
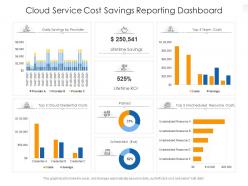
Cloud service cost savings reporting dashboard snapshot




Try Before you Buy Download Free Sample Product
 Impress Your
 Audience
 100%
100% Editable
 Save Hours
 of Time


Our Cloud Service Cost Savings Reporting Dashboard Snapshot are topically designed to provide an attractive backdrop to any subject. Use them to look like a presentation pro.
People who downloaded this PowerPoint presentation also viewed the following :
Cloud service cost savings reporting dashboard snapshot with all 2 slides:
Use our Cloud Service Cost Savings Reporting Dashboard Snapshot to effectively help you save your valuable time. They are readymade to fit into any presentation structure.
FAQs for Cloud service cost savings
Start with cost per service and track how your monthly spending changes - that's your bread and butter. Resource utilization is huge because nothing's worse than paying for stuff that just sits there doing nothing. I'd definitely add rightsizing recommendations and reserved instance coverage too. Oh, and cost allocation by team is a lifesaver when you need to figure out who's burning through the budget. Spot instance savings and storage optimization help round things out. The trick is having both the big picture trends and the nitty-gritty details in one dashboard, so you're not constantly jumping between screens to make decisions.
Honestly, the secret is good tagging from day one - department, project, dev/staging/prod, cost center, all that stuff. Most cloud providers let you make custom tags too which is clutch. I'd group your dashboard by service type, usage patterns, and business function. Yeah, tagging everything upfront is boring as hell but trust me, you'll thank yourself later. Set up automated rules wherever you can and do monthly checks for anything you missed. The dashboard part's pretty straightforward once your tagging game is solid.
Start with real-time data connectors and automated tagging - that's where the magic happens. AWS Cost Explorer and Azure Cost Management give you the basics, but honestly their native dashboards are pretty meh. You'll need something like CloudHealth or Datadog to actually understand what's going on. Grafana's great for visualization once you connect it to your cost allocation tags. Oh and seriously, get your tagging strategy nailed down first - I learned that the hard way. Set up automated pipelines so you're not stuck updating spreadsheets every Friday. Everything else just clicks into place after that.
Dude, seasonal stuff will mess up your forecasts big time if you ignore it. Like, retail sees 3x spikes during holidays, education drops in summer - that's just normal life. We totally whiffed on Black Friday last year because our "smart" model treated it like some weird anomaly instead of... you know, the biggest shopping day ever? Build those patterns right into your baseline from the start. Otherwise you'll get pinged constantly about "unusual" spending that's actually perfectly normal. Set your alerts to expect the seasonal swings so you're not panicking every December thinking something's broken.
Automation is honestly a game-changer for keeping cloud costs down. It'll scale your resources up and down automatically based on what you actually need, plus shut down stuff that's just sitting there doing nothing. You can even have it move workloads to cheaper regions when things are slow. Trust me, doing this manually is mind-numbing and expensive - like, who has time for that? Set up your dashboard to trigger these automations when you hit certain cost limits or usage patterns. Start simple with basic auto-scaling. Then add fancier rules once you've got the hang of it.
Honestly, ML is pretty good at predicting cloud costs once you feed it your usage history. It'll catch weird patterns you'd never notice - like costs spiking before launches or that random Tuesday thing that happens monthly. Just connect your billing API to any forecasting tool and give it deployment schedules, user growth data, whatever you have. Takes a few weeks to learn your baseline but then you get predictions months out. Way better than those surprise bills that make you panic. I started doing this after getting burned too many times - now I actually know what's coming.
Start with the obvious stuff your dashboard's showing - kill those unused instances and right-size anything that's way overprovisioned. Reserved instances are honestly a no-brainer for steady workloads (you'll save like 30-70% vs on-demand). Auto-scaling's clutch because it matches your actual usage instead of planning for doomsday scenarios. Those storage cleanup recommendations? Usually easy money. I'd hit whatever has the biggest dollar signs first, then set up some automated rules so this mess doesn't happen again. Oh, and actually check the dashboard weekly or you'll be back where you started.
Ugh, multi-cloud cost tracking is such a pain. Each provider has completely different pricing models and billing formats - like you're comparing apples to oranges to whatever weird fruit Azure made up. Your spending data gets scattered across different dashboards that don't talk to each other. Plus you miss out on volume discounts when everything's spread around. Honestly, the only way I've seen this work is getting a centralized cost management tool that pulls everything into one view. Still feels like herding cats sometimes though.
Don't try to track everything at once - that's the fastest way to create a useless mess nobody looks at. Teams also love cutting costs without thinking about what it'll break (spoiler: everything). You need someone actually owning the thing, or it just sits there collecting digital dust. Oh, and fix your tagging first - seriously, garbage data makes garbage dashboards. Most fail because they show problems but zero solutions. I'd start with maybe 3-5 metrics that actually matter for decisions. You can always add more weird stuff later once people are using it.
Dude, you gotta turn that cloud spending data into something people can actually understand. Charts and graphs tell the story way better than boring spreadsheets – honestly, executives' eyes glaze over with raw numbers. When they can see that dev costs jumped 40% last month, suddenly they care about fixing it. It's like showing a movie instead of handing someone a phone book, you know? Way more engaging. Pick one important metric first and build a simple visual story around it. Don't overthink it – just make the data tell people where their money's going.
Honestly? Daily updates are ideal but weekly minimum. Set up automated refreshes - trust me, you don't want to be manually pulling reports every damn time. Monthly reviews of your actual metrics matter too since what felt important six months ago might be total garbage now. Get your team doing regular dashboard check-ins so everyone's on the same page with cost targets. The real trick is making it routine instead of that panic moment when your AWS bill shows up and you're like "wait, what happened here?" Consistency beats perfection on this one.
So user roles control what cost stuff you can actually see in the dashboard. Viewers only get read-only access to their specific projects or departments. Admins see everything - all accounts, spending, and they can change budgets and set up alerts. Finance teams usually get way more visibility than individual devs who might just see their team's costs. Some companies go crazy detailed with the permissions honestly. The main thing is matching your role to what you need for your actual work, otherwise you're either missing critical data or drowning in costs that don't matter to you.
So Netflix cut their AWS bill by 30% just by setting up real-time dashboards to track which teams were spending what. Pretty genius, right? Spotify pulled off something similar - they automated alerts whenever costs hit certain thresholds and saved 25%. Here's what I'd do: get those automated notifications running first, then break down costs by department so people can actually see their impact. The trick is getting everyone involved, not just dumping it all on finance. When teams can see their own spending in real-time, they'll naturally start optimizing. Works way better than quarterly budget meetings.
Honestly, start by grabbing benchmark data from Flexera or those RightScale cloud reports - they're pretty solid. Set up comparison views for your spend per workload or per user against industry averages. Filter by company size too since startups obviously spend way less than big corporations. Don't just track raw dollar amounts though, that's kinda useless. Focus on stuff like cost per transaction or monthly growth rates instead. Pick maybe 2-3 ratios that actually matter for your business and create alerts when you're drifting above the norm. Way easier than drowning in data you'll never look at.
Honestly, cloud cost transparency just ends those awkward "who spent what?" fights between teams. You can finally see which department is burning through AWS money - marketing suddenly owns their storage costs, and engineering has to explain that pricey ML instance they forgot was running. It's like splitting a restaurant bill properly instead of everyone paying the same amount! Teams actually start watching their own spending once they see the real numbers. I'd start by just showing each team their monthly breakdown. Way better than IT taking the blame for everything, you know?
-
Commendable slides with attractive designs. Extremely pleased with the fact that they are easy to modify. Great work!
-
Unique and attractive product design.
-
Easily Editable.