


Cost Allocation Methods Powerpoint Presentation Slides




Try Before you Buy Download Free Sample Product
 Impress Your
 Audience
 100%
100% Editable
 Save Hours
 of Time


This Cost allocation PowerPoint presentation provides details on the distribution of one cost across multiple entities,business units,and cost centers. Here is a professionally designed Cost Allocation Methods template that can provide the management with essential data about cost utilization in making decisions. It also covers cost objects that take up most of the costs and helps determine if the departments or products are profitable enough to justify the expenses allocated. The main objective of this presentation is to help users give costs to predict the economic effects of planning and control decisions,motivate managers and employees,measure the costs of inventory and cost of goods sold,and justify costs for pricing or reimbursement. This PPT includes cost allocation methods such as direct labor,machine time used,square footage,and units produced. Customize this 100 percent editable template now.
People who downloaded this PowerPoint presentation also viewed the following :
Content of this Powerpoint Presentation
Slide 1: This slide introduces Cost Allocation Methods. State Your Company Name and begin.
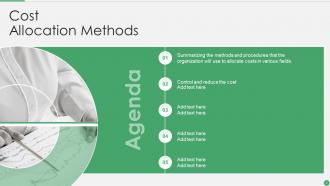
Slide 2: This is an Agenda slide. State your agendas here.
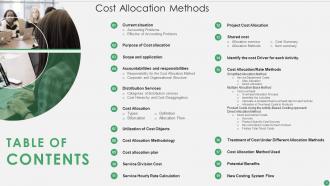
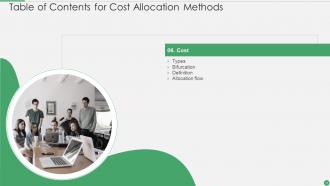
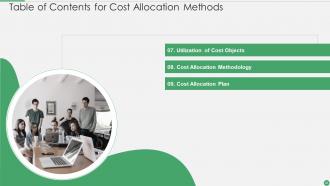
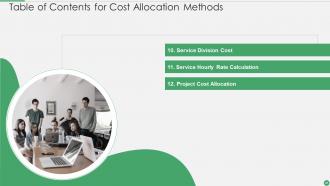
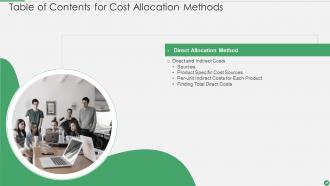
Slide 3: This slide presents Table of Content for the presentation.
Slide 4: This slide highlights title for topics that are to be covered next in the template.
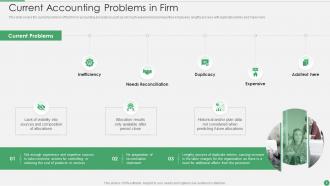
Slide 5: This slide covers the current problems of the firm in accounting procedures.
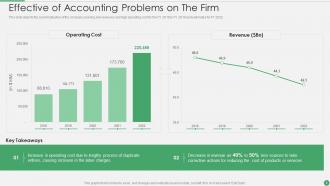
Slide 6: This slide shows Effective of Accounting Problems on The Firm.
Slide 7: This slide highlights title for topics that are to be covered next in the template.
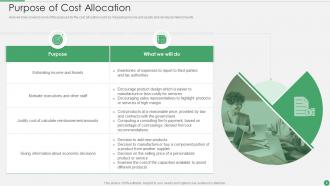
Slide 8: This slide displays purpose for the cost allocation such as measuring income and assets.
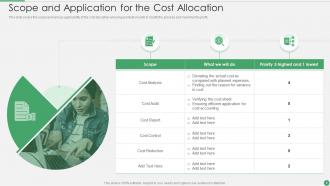
Slide 9: This slide represents Scope and Application for the Cost Allocation.
Slide 10: This slide highlights title for topics that are to be covered next in the template.
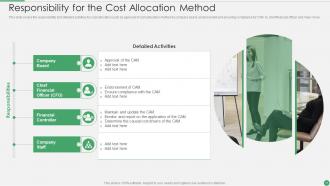
Slide 11: This slide covers the responsibility and detailed activities for cost allocation.
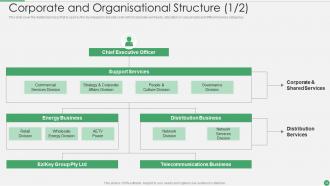
Slide 12: This slide represents Corporate and Organisational Structure.
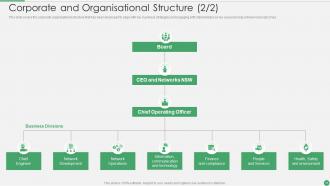
Slide 13: This slide showcases corporate organizational structure that has been developed to align with key business.
Slide 14: This slide highlights title for topics that are to be covered next in the template.
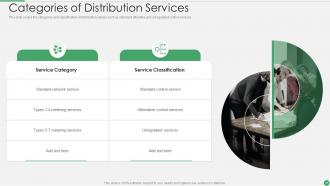
Slide 15: This slide covers the categories and classification of distribution services.
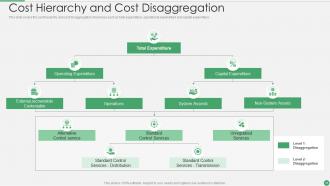
Slide 16: This slide displays cost hierarchy and cost disaggregation of services such as total expenditure, operational expenditure, etc.
Slide 17: This slide highlights title for topics that are to be covered next in the template.
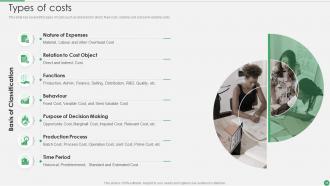
Slide 18: This slide represents types of costs such as direct and in direct, fixed cost, variable cost, etc.
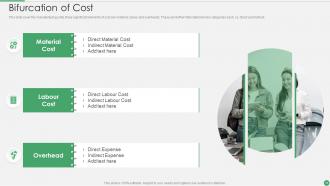
Slide 19: This slide showcases manufacturing units along with three significant elements of cost.
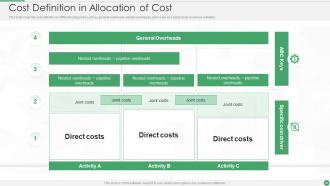
Slide 20: This slide presents Cost Definition in Allocation of Cost.
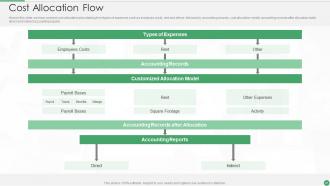
Slide 21: This slide displays cost allocation plan starting from types of expenses such as employee costs, rent and others.
Slide 22: This slide highlights title for topics that are to be covered next in the template.
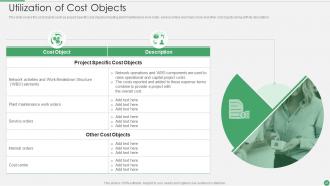
Slide 23: This slide represents the cost objects such as project specific cost objects.
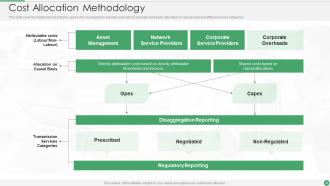
Slide 24: This slide cover the detailed process that is used by the businesses to allocate costs.
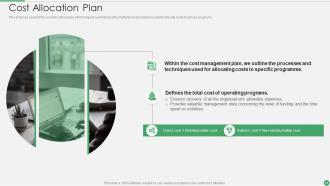
Slide 25: This slide showcases cost allocation plans which helps in summarizing the methods and procedures used to allocate costs to various programs.
Slide 26: This slide highlights title for topics that are to be covered next in the template.
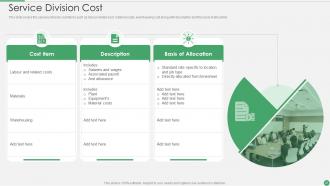
Slide 27: This slide shows services division cost items such as labour related cost, material costs, warehousing cost, etc.
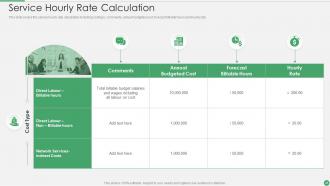
Slide 28: This slide presents the service hourly rate calculation including cost type, comments, annual budgeted cost, etc.
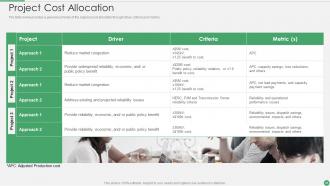
Slide 29: This slide displays general summary of the regional cost allocation through driver, criteria and metrics.
Slide 30: This slide highlights title for topics that are to be covered next in the template.
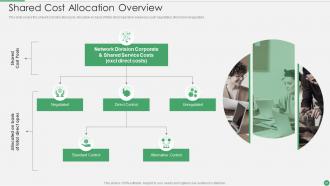
Slide 31: This slide covers the shared cost allocation pool, allocation on basis of total direct operation expenses.
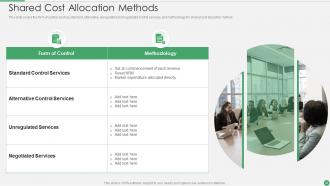
Slide 32: This slide presents form of control such as standard, alternative, unregulated, etc.
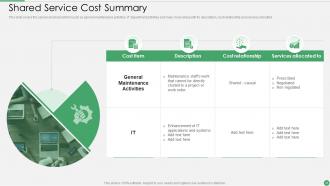
Slide 33: This slide displays service shared cost item such as general maintenance activities, IT department activities and many more.
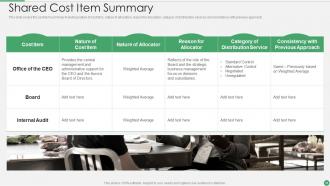
Slide 34: This slide covers the cost item summary including nature of cost item, nature of allocation, reason for allocation, etc.
Slide 35: This slide highlights title for topics that are to be covered next in the template.
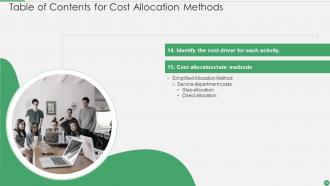
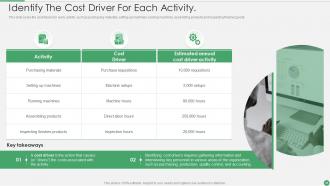
Slide 36: This slide represents Identify The Cost Driver For Each Activity.
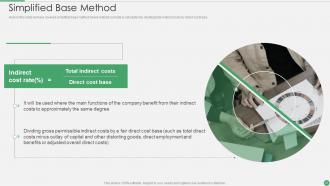
Slide 37: This slide showcases simplified base method where indirect cost rate is calculated by dividing total indirect costs by direct cost base.
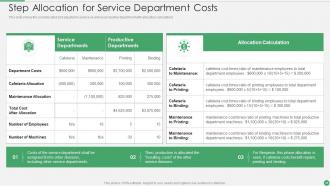
Slide 38: This slide shows Step Allocation for Service Department Costs.
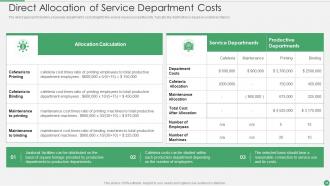
Slide 39: This slide presents Direct Allocation of Service Department Costs.
Slide 40: This slide highlights title for topics that are to be covered next in the template.
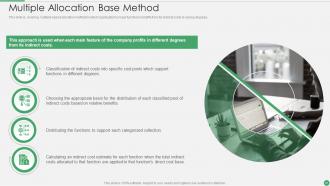
Slide 41: This slide displays multiple based allocation method in which organization’s major functions benefits from its indirect costs.
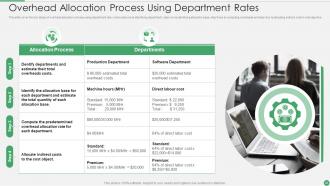
Slide 42: This slide represents Overhead Allocation Process Using Department Rates.
Slide 43: This slide showcases Identified The Following Activities As Having The Biggest Impact On Overhead Costs.
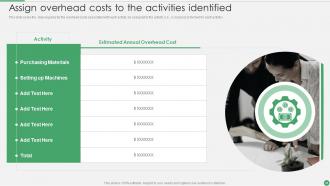
Slide 44: This slide shows Assign overhead costs to the activities identified.
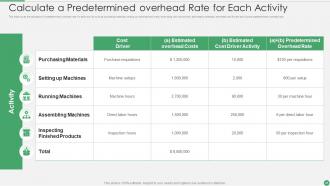
Slide 45: This slide coves the calculation of predetermined overhead rate for each activity.
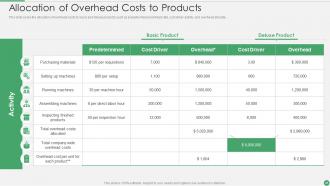
Slide 46: This slide displays allocation of overhead costs to basic and deluxe products .
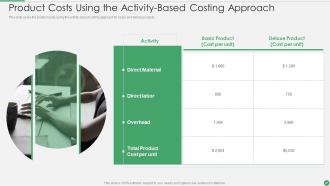
Slide 47: This slide represents Product Costs Using the Activity-Based Costing Approach.
Slide 48: This slide highlights title for topics that are to be covered next in the template.
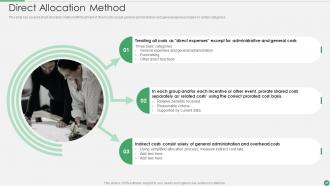
Slide 49: This slide showcases direct allocation method with treatment of direct costs.
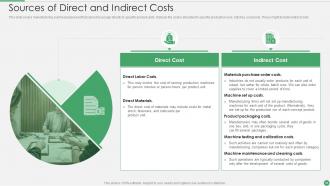
Slide 50: This slide presents manufacturing overhead expenses that cannot be assign directly to specific product.
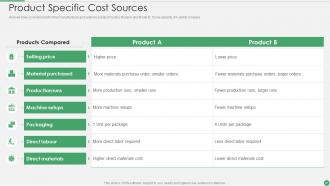
Slide 51: This slide displays Product Specific Cost Sources describing- Selling price, Direct materials, Direct labour, etc.
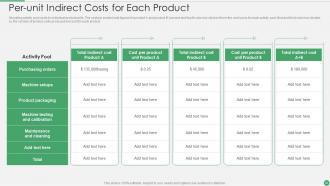
Slide 52: This slide represents Per-unit Indirect Costs for Each Product.
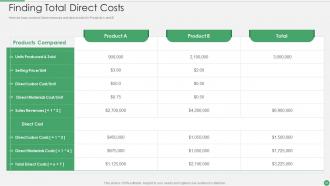
Slide 53: This slide showcases Finding Total Direct Costs with Sales revenues and direct costs for Products A and B.
Slide 54: This slide highlights title for topics that are to be covered next in the template.
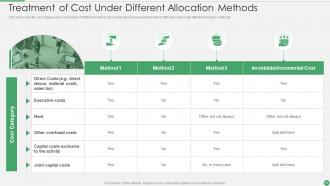
Slide 55: This slide shows Treatment of Cost Under Different Allocation Methods.
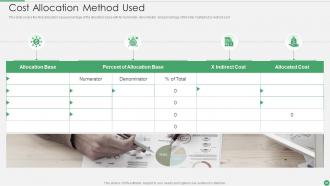
Slide 56: This slide presents final allocation base percentage of the allocation base.
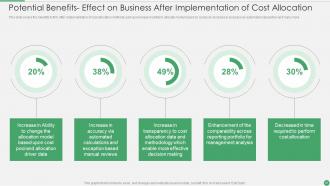
Slide 57: This slide displays Potential Benefits Effect on Business After Implementation of Cost Allocation.
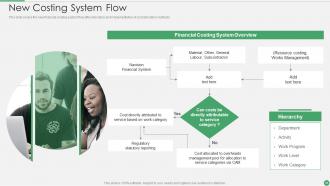
Slide 58: This slide covers the new financial costing system flow after allocation and implementation of cost allocation methods.
Slide 59: This slide showcases Icons for Cost Allocation Methods.
Slide 60: This slide is titled as Additional Slides for moving forward.
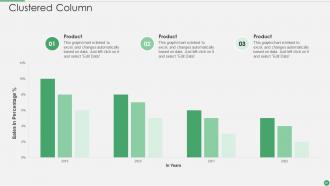
Slide 61: This slide provides Clustered Column chart with two products comparison.
Slide 62: This is Our Mission slide with related imagery and text.
Slide 63: This is About Us slide to show company specifications etc.
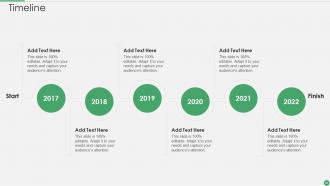
Slide 64: This is a Timeline slide. Show data related to time intervals here.
Slide 65: This slide contains Puzzle with related icons and text.
Slide 66: This slide provides 30 60 90 Days Plan with text boxes.
Slide 67: This slide shows Post It Notes. Post your important notes here.
Slide 68: This is a Thank You slide with address, contact numbers and email address.
Cost Allocation Methods Powerpoint Presentation Slides with all 73 slides:
Use our Cost Allocation Methods Powerpoint Presentation Slides to effectively help you save your valuable time. They are readymade to fit into any presentation structure.








FAQs for Cost Allocation Methods
So there's basically three main ways to handle cost allocation in manufacturing. Direct costing is the easiest - you just assign costs straight to products. Then there's ABC (activity-based costing) which tracks the actual activities driving your costs. Way more accurate but honestly such a headache to implement. Traditional overhead allocation just spreads indirect costs using stuff like labor hours or machine time. Which one you pick really depends on how complicated your setup is. If you're doing simple stuff, don't overcomplicate it. But if you need precise pricing data, ABC might be worth the hassle despite all the extra work upfront.
Okay so direct costs are pretty easy - stuff you can trace straight to a product, like materials or labor. Indirect costs though? Total pain. You've got shared expenses like rent and utilities that somehow need to get split up between projects. Most people use square footage or labor hours as their basis, but honestly it's kinda arbitrary no matter what method you pick. I'd start by figuring out what's actually traceable first. Then just pick something reasonable for the rest - don't overthink it too much.
ABC is way better than traditional costing because it tracks what activities each product actually uses - like setup time, inspections, material handling. Traditional methods just spread costs around based on labor hours or machine time, which is pretty lazy tbh. Yeah, it's more work upfront mapping out your key activities and cost drivers. But you'll actually know what things cost instead of guessing. I've seen companies realize their "profitable" products were money pits once they switched. Start small with your biggest cost centers first.
Honestly, just be super transparent about everything from the start. Document your methods clearly and stick to them - no playing favorites with certain departments because everyone will definitely call you out on it. Ask department heads what they think about your allocation bases so they're not blindsided later. Square footage works great for facility costs, headcount for HR stuff, you know the drill. Pick drivers that actually make logical sense. Oh, and prepare yourself for the inevitable "but why did you do it THIS way" conversations. Having solid reasoning ready saves so much headache.
When your cost allocation is wrong, everything gets screwed up - product profitability, inventory, COGS, the works. You'll think one product is crushing it while another's tanking, but it's completely backwards. Makes you price things wrong and pick terrible product mixes. Honestly, I've watched teams spin their wheels for months because nobody bothered checking if their numbers made sense. Your auditors won't be thrilled either if it's material enough. What I'd do? Test your allocation methods against real costs every so often. It's boring work but saves you from making decisions based on fantasy numbers.
So fixed costs don't change no matter what, right? Allocate those based on stable stuff like square footage or how many people you have - definitely not production volume. Variable costs are the opposite since they move with activity, so use things like machine hours or units produced. Mixed costs are honestly the biggest pain because they're part fixed, part variable. You've gotta separate those components first before you even think about allocation. The whole point is matching cost behavior to whatever base you're using. Otherwise your product costs get all wonky and you'll make terrible pricing calls.
So here's the deal with standard costing - you get super consistent rates for budgeting, which honestly makes life easier. Spotting variances becomes quick work. Your bookkeeping stays simple too since you're not updating rates constantly. But here's where it gets tricky: if your actual costs jump around a lot (and let's be real, they usually do), standard costing starts feeling pretty disconnected from what's actually happening. You'll still end up analyzing variances anyway, which kinda defeats the purpose sometimes. Works great if your operations are stable though. I'd check how much your costs bounce around month to month first - that'll tell you if it's worth it.
Dude, get some automation software for that cost allocation stuff - it'll save you from those endless spreadsheet nights. Most tools let you set up rules once, then they handle the distribution automatically. Real-time tracking is pretty sweet too. Cloud platforms sync with whatever accounting system you're already using, so no double data entry headaches. Plus you won't have those random Excel typos screwing everything up (we've all been there). Your team can actually analyze results instead of just calculating them. Honestly, just figure out which tasks eat up the most time and find software that tackles those first.
Here's how it works - whatever cost allocation method you pick totally shapes your pricing. Activity-based costing might show you that Product A actually costs way more than you realized (been there!), which means your prices are probably wrong. Traditional methods using direct labor hours? They oversimplify everything and you end up underpricing complex stuff while overpricing the simple products. It's honestly pretty frustrating when you realize this. Your whole pricing foundation depends on getting the allocation method right. I'd take a hard look at your current approach - does it actually match how you're using resources day-to-day?
So basically, companies just pick whatever matches how they actually spend money. Manufacturing? They go with activity-based costing since they can track materials and labor pretty easily. Consulting firms are all about time-based allocation - makes sense when you're literally billing hours. Healthcare is honestly kind of a mess though - they'll use patient days, procedures, square footage, whatever works for that specific department. Retail keeps it simple with sales percentages mostly. Just figure out what makes your costs go up and base your method on that. Way easier than overthinking it.
Honestly, start with what your grants actually require - that stuff's set in stone and you can't mess around with it. Your funders and auditors have their own rules about splitting costs between programs and admin. Think about how much time you want your staff spending on tracking this. Some methods are a total pain and eat up way more hours than they're worth. Whatever you pick needs to match how your org actually operates day-to-day. Don't overcomplicate it - simpler is almost always better in my experience. Just make sure it's something you can realistically stick with long-term without driving everyone crazy.
Honestly, most PMs I know just look at direct costs and wonder why their "profitable" projects aren't actually making money. You've got to allocate overhead properly or you're flying blind. Budget forecasts get so much more accurate when you bake in those allocated costs from the start. Plus you'll catch resource issues way earlier. Quick reality check though - if you're just splitting overhead evenly across projects, you're missing huge insights about which ones are actually efficient. It's like... why wouldn't you want that data? Review your allocation method first. Trust me, the clearer picture is worth the extra work upfront.
Honestly, the worst part is dealing with department heads who freak out when their costs suddenly look higher. Nobody wants their budget to tank, you know? Data quality becomes a nightmare too - your current systems probably don't track the detailed stuff these new methods need. Staff training drags on forever since people hate change. Oh, and you might end up buying expensive new software which is fun. But here's what worked for me: pick one department to test it out first. Get some solid wins, then wave those success stories in front of the doubters. Way easier than fighting everyone at once.
Dude, compliance totally dictates how you allocate costs - no wiggle room. Healthcare follows CMS rules for Medicare stuff. Utilities need regulator-approved rate methods. Banking's got those Basel III capital requirements (honestly such a headache). You can't just pick whatever makes your numbers pretty anymore. Each industry has its own playbook with specific audit trails and documentation. Oh, and the prescribed approaches are usually non-negotiable. Start with checking your sector's framework before building anything. Trust me, redoing the whole system later because you missed regulatory requirements? Expensive mistake nobody wants to make.
Honestly, I'd check this stuff quarterly if your business moves fast - otherwise once a year works. Big shifts in cost drivers are your main clue. Like when labor suddenly costs way more than materials, or a department doubles in size. Compare what you're allocating vs what's actually happening. Product A getting 20% of overhead but using 35% of machine hours? Yeah, that's broken. I always set calendar reminders for this because it's so easy to forget. Oh and definitely write down why you changed things - future you will thank you for the notes when someone asks questions later.
-
The designs by SlideTeam are honestly the best I have seen so far. Will be definitely coming back for more.
-
Wow, never been this impressed with any online service provider. Really appreciate the customer support all along from the navigation to purchasing the right products.