
Asset Allocation Management Powerpoint Presentation Slides


Try Before you Buy Download Free Sample Product
 Impress Your
 Audience
Editable
of Time


We bring to you to the topic-specific Asset Allocation Management Powerpoint Presentation Slides with apt research and understanding. The ready to use strategic portfolio management presentation deck includes set of content ready PPT slides such as introduction to investments, objectives of portfolio management, types of investment, market scenario overview investment instruments, securities portfolio, analysis and valuation of equity securities, industry analysis PESTEL, SWOT analysis, discounted cash flow method, financial statement analysis, company cash flow statement, investment in special situations, fixed income and leveraged securities, bond valuation system, reinvestment risk table, type of convertible securities, options analysis, warrants summarization overview, derivative products, put and call options, stock index futures and options, stock indexes comparison table, broaden the investment perspective, international security market highlights, global market trends, mutual funds investment criteria overview, investment in real estate, diversified real estate classification, KPIs and dashboards etc. Simply download the portfolio analysis PPT visuals and capture your audience's attention. Highlight the fact that you have the credentials with our Asset Allocation Management Powerpoint Presentation Slides. You will emerge as the favorite candidate.
People who downloaded this PowerPoint presentation also viewed the following :
Content of this Powerpoint Presentation
Slide 1: This slide introduces Asset Allocation Management. State Your company name and begin.
Slide 2: This is an Agenda slide. State your agendas here.
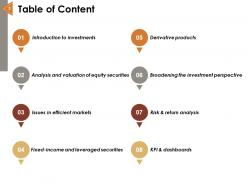
Slide 3: This slide shows Table of Content for the presentation.
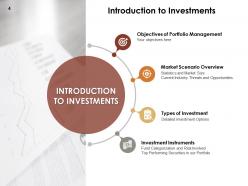
Slide 4: This slide presents Introduction to Investments describing- Objectives of Portfolio Management, Investment Instruments, Types of Investment, Market Scenario Overview.
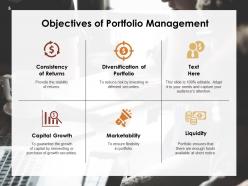
Slide 5: This slide displays Objectives of Portfolio Management describing- Capital Growth, Marketability, Liquidity, Consistency of Returns, Diversification of Portfolio, Objective.
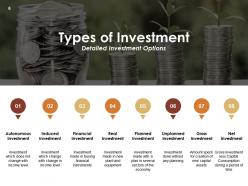
Slide 6: This slide represents Types of Investment - Detailed Investment Options describing- Autonomous Investment, Induced Investment, Financial Investment, Real Investment, Planned Investment, Unplanned Investment, Gross Investment, Net Investment.
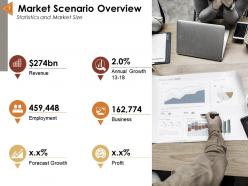
Slide 7: This slide showcases Market Scenario Overview - Statistics and Market Size describing- Revenue, Annual Growth 13-18, Forecast Growth, Profit, Employment, Business.
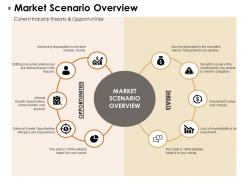
Slide 8: This slide shows Market Scenario Overview - Current Industry Threats & Opportunities with related text to elaborate.
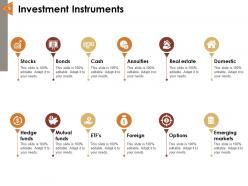
Slide 9: This slide presents Investment Instruments which includes- Stock, Annuities, Bond, Cash, Real Estate, Mutual Funds, Domestic, Hedge Funds, ETF’s, Emerging Markets, Foreign Options.
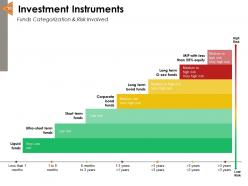
Slide 10: This slide displays Investment Instruments - Funds Categorization and Risk Involved as- Liquid funds, Ultra - short term funds, Short term funds, Corporate bond funds, Long term bond funds, Long term G-sec funds, MIP with less than 25% equity.
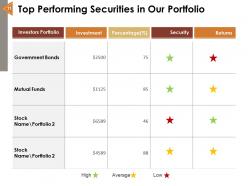
Slide 11: This slide represents Top Performing Securities in Our Portfolio with categories as- Investor’s Portfolio, Investment, Percentage, Security, Returns.
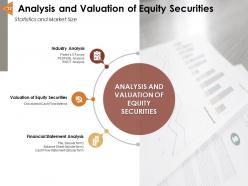
Slide 12: This slide showcases Analysis and Valuation of Equity Securities describing- Industry Analysis, Financial Statement Analysis, Valuation of Equity Securities.
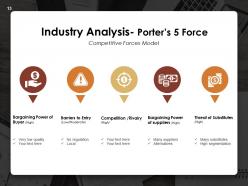
Slide 13: This slide shows Industry Analysis - Porter’s 5 Forces as- Competition/Rivalry, Bargaining Power -Suppliers, Barriers To Entry, Threat of Substitutes, Bargaining Power Buyers.
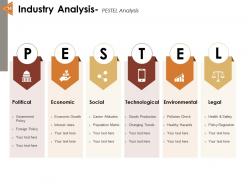
Slide 14: This slide presents Industry Analysis - PESTEL Analysis which include Political, Economic, Social, Technological, Environment and Legal analysis.
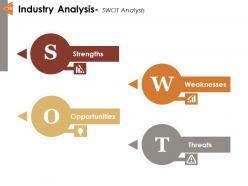
Slide 15: This slide displays Industry Analysis - SWOT Analysis as- Strengths, Weaknesses, Opportunities and Threats analysis.
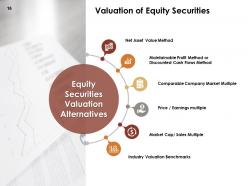
Slide 16: This slide represents Valuation of Equity Securities describing- Net Asset Value Method, Maintainable Profit Method or Discounted Cash Flows Method, Comparable Company Market Multiple, Price / Earnings multiple, Market Cap/ Sales Multiple, Industry Valuation Benchmarks.
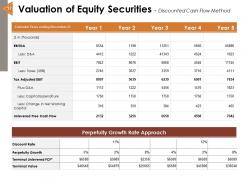
Slide 17: This slide showcases Valuation of Equity Securities - Discounted Cash Flow Method describing- DCF Valuation, Projected Free Cash Flow, Perpetuity Growth Rate Approach.
Slide 18: This slide shows Financial Statement Analysis - P&I Statement in Tabular form with net sales, total income, total expenses, profit before and after tax etc.
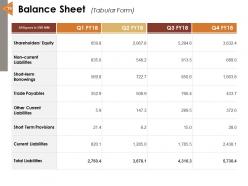
Slide 19: This slide presents Balance Sheet in Tabular form with total liabilities.
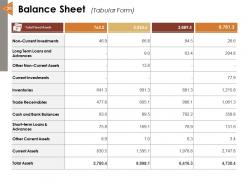
Slide 20: This slide presents Balance Sheet in Tabular form with total assets.
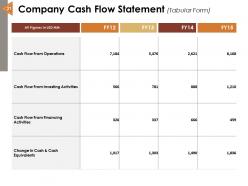
Slide 21: This slide displays Company Cash Flow Statement in Tabular form describing- Cash flow from operations, cash flow from investing activities, cash flow from financing activities, change in cash and cash equivalents etc.
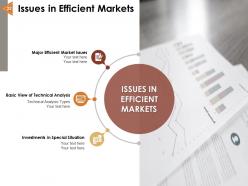
Slide 22: This slide represents Issues in Efficient Markets describing- Major Efficient Market Issues, Investments in Special Situation, Basic View of Technical Analysis.
Slide 23: This slide showcases Major Efficient Market Issues as- Transactions Cost related to exchange of goods and services overcome market imperfections, Regulatory Restrictions that are subject to control and guidelines for efficient market etc.
Slide 24: This slide shows Technical Analysis Types with chart patterns, technical indicators and key result areas.
Slide 25: This slide presents Investments in Special Situations with icons and text boxes to show information.
Slide 26: This slide displays Fixed-Income and Leveraged Securities describing- Bond and Fixed-Income Securities, Convertible Securities & Warrants, Duration & Reinvestment, Bond Valuation.
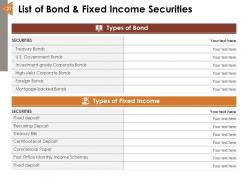
Slide 27: This slide represents List of Bond & Fixed Income Securities in a tabular form with related text.
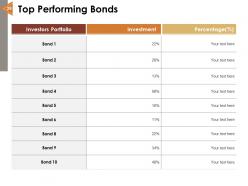
Slide 28: This slide showcases Top Performing Bonds with categories as- Security, Holding Period Returns, Class.
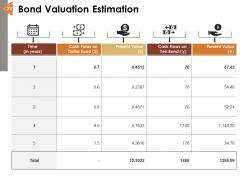
Slide 29: This slide shows Bond Valuation Estimation with categories as- Time, Cash Flows on Dollar Bond, Present Value, Cash Flows on Yen Bond, Present Value.
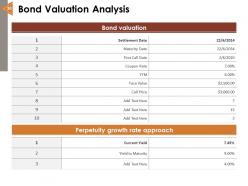
Slide 30: This slide presents Bond Valuation Analysis describing- Bond Valuation and Return Measures.
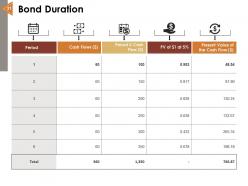
Slide 31: This slide displays Bond Duration with categories as- Period Cash Flows ($) Period X Cash Flow ($) PV of $1 at 5% Present Value of the Cash Flow ($)
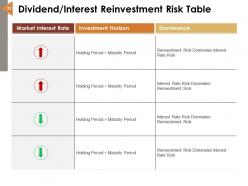
Slide 32: This slide represents Dividend \ Interest Reinvestment Risk Table with categories as- Market Interest Rate, Investment Horizon, Dominance.
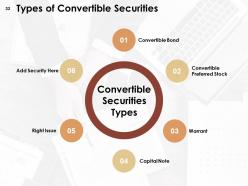
Slide 33: This slide showcases Types of Convertible Securities describing- Convertible Bond, Convertible Preferred Stock, Warrant, Capital Note, Right Issue.
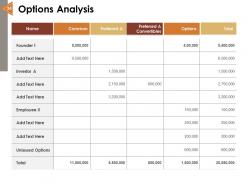
Slide 34: This slide shows Options Analysis in tabular form with related text.
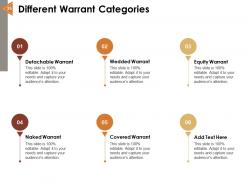
Slide 35: This slide presents Different Warrant Categories as- Detachable Warrant, Wedded Warrant, Naked Warrant, Covered Warrant, Equity Warrant etc.
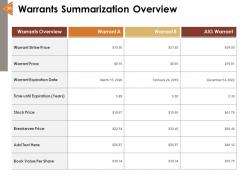
Slide 36: This slide displays Warrants Summarization Overview with warrant price, warrant expiration date, stock price etc.
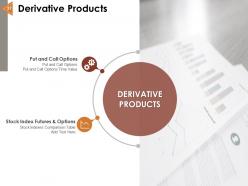
Slide 37: This slide represents Derivative Products such as- Put and Call Options and Stock Index Futures and Options.
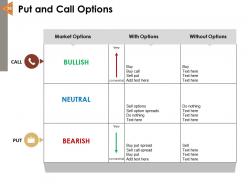
Slide 38: This slide showcases Put and Call Options with categories as Bullish, Neutral, Bearish.
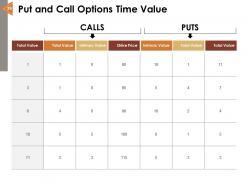
Slide 39: This slide shows Put and Call Options Time Value in tabular form with categories as- Total Value, Time Value, Intrinsic Value, Strike Price, Intrinsic Value, Time Value, Total Value.
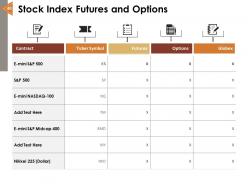
Slide 40: This slide presents Stock Index Futures and Options with categories as- Contract, Ticker Symbol, Futures, Options, Globex.
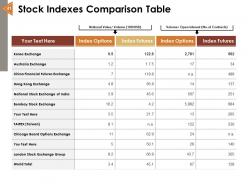
Slide 41: This slide displays Stock Indexes Comparison Table comparing exchanges such as- Korea exchange, Australia exchange, Hong kong stock exchange, bombay stock exchange etc.
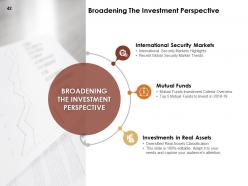
Slide 42: This slide represents Broadening the Investment Perspective describing- International Security Markets, Investments in Real Assets, Mutual Funds.
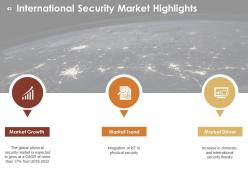
Slide 43: This slide showcases International Security Market Highlights describing- Market Growth, Market Trend, Market Driver.
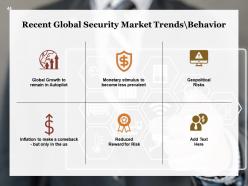
Slide 44: This slide shows Recent Global Security Market Trends\Behavior describing- Inflation to Make a Comeback - But Only in the Us, Global Growth to Remain in Autopilot, Monetary Stimulus To Become Less Prevalent, Reduced Reward for Risk, Geopolitical Risks etc.
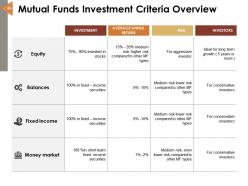
Slide 45: This slide presents Mutual Funds Investment Criteria Overview with parameters as- Equity, Balanced, Fixed Income, Money Market.
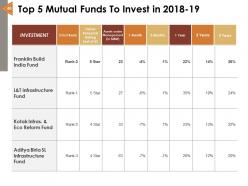
Slide 46: This slide displays Top 5 Mutual Funds to Invest in 2018-19 witch categories as- MUTUAL FUND, Crisil rank, Value research rating, Assets under management etc.
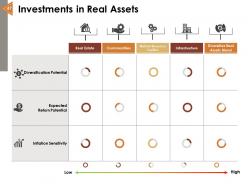
Slide 47: This slide represents Investments in Real Assets such as- Real Estate, Commodities, Natural Resource Equities, Infrastructure, Diversifies Real Assets Blend.
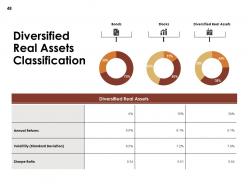
Slide 48: This slide showcases Diversified Real Assets Classification describing- annual returns, Volatility, Shape ratio etc.
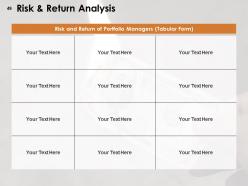
Slide 49: This slide shows Risk & Return Analysis in a tabular form with text boxes to show information.
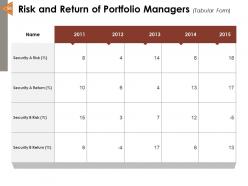
Slide 50: This slide presents Risk and Return of Portfolio Managers in Tabular form with years, security risk, security return etc.
Slide 51: This slide displays KPI & Dashboard describing- KPI Dashboard and KPI Metrics.
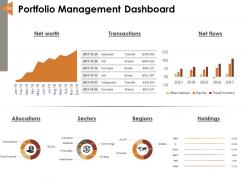
Slide 52: This slide represents Portfolio Management Dashboard with- Allocations, Sectors, Regions, Net Worth, Holdings, Net Flow, Transactions.
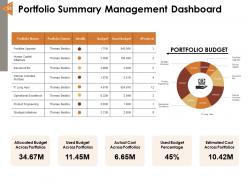
Slide 53: This slide showcases Portfolio Summary Management Dashboard with- Portfolio Name, Portfolio Owner, Health, Budget, Used Budget, Projects.
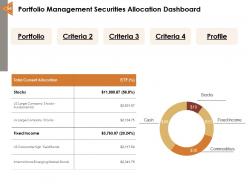
Slide 54: This slide shows Portfolio Management Securities Allocation Dashboard with Portfolio, Criterias, Profile etc.
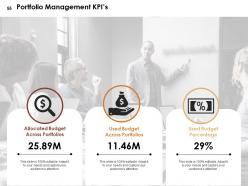
Slide 55: This slide presents Portfolio Management KPI’s describing- Allocated Budget Across Portfolios, Used Budget Percentage, Used Budget Across Portfolios.
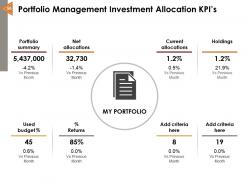
Slide 56: This slide displays Portfolio Management Investment Allocation KPI’s Portfolio Summary Net Allocation Used Budget percentage, Current allocations etc.
Slide 57: This slide showcases Asset Allocation Management- Icons.
Slide 58: This slide is titled as Additional Slides for moving forward.
Slide 59: This is Our Team slide with names and designation.
Slide 60: This is About Us slide to show company specifications etc.
Slide 61: This slide reminds about a Coffee Break.
Slide 62: This is Our Goal slide. Show your firm's goals here.
Slide 63: This is a Comparison slide to state comparison between commodities, entities etc.
Slide 64: This is a Quotes slide to convey message, beliefs etc.
Slide 65: This slide shows Mind Map for representing entities.
Slide 66: This is a Venn slide with additional text boxes to show information.
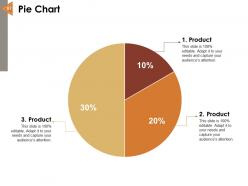
Slide 67: This slide displays Pie Chart with data in percentage.
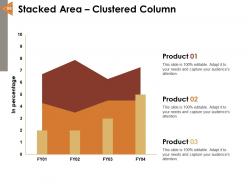
Slide 68: This slide showcases Stacked Area – Clustered Column chart with three products comparison.
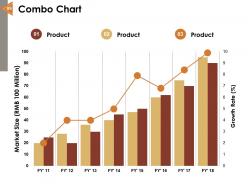
Slide 69: This slide shows Combo Chart with three products comparison.
Slide 70: This is a Thank you slide for acknowledgement.
Asset Allocation Management Powerpoint Presentation Slides with all 70 slides:
Eradicate ingrained flaws with our Asset Allocation Management Powerpoint Presentation Slides. Identify how they came about.


FAQs for Asset Allocation Management
Look, it really comes down to three big things: how long you've got, how much risk you can stomach, and what you're actually trying to achieve. If you're young, you can probably handle way more stocks since you've got like 30+ years to weather the crazy swings. Getting closer to retirement? Time to dial back the risk with more bonds and stable stuff. Honestly though, your sleep-at-night factor matters most - if a 20% drop makes you panic-sell everything, maybe tone down the aggressive picks. Market conditions affect things too, but I wouldn't go making huge moves based on headlines. Figure out your timeline first, then work backwards.
Risk tolerance is basically how much your portfolio can tank before you freak out. Conservative folks usually go 30% stocks, 70% bonds - boring but stable. Me? I think the real question isn't what gains you want, it's what losses won't make you panic-sell everything. Aggressive investors might do 80/20 or 90/10 stocks to bonds since they can handle the roller coaster. Start by imagining your portfolio drops 20% tomorrow. Can you sleep at night? That'll tell you if you're more of a 40/60 person or ready to go heavy on stocks.
Time horizon is honestly the biggest factor in how you should invest. Got 30+ years? Load up on stocks - you'll have plenty of time to bounce back from crashes. But if you need money in under 5 years, stick with boring bonds and cash. You really can't risk losing 30% right before buying a house or whatever. Here's how I think about it: longer timeline = more room to mess up and recover. So figure out when you actually need each chunk of money, then decide how risky you can afford to be with it.
Honestly, volatility can work in your favor if you don't freak out about it. Your portfolio basically rebalances itself - stocks tank while bonds stay steady, which shifts your percentages around. Don't panic-sell when everything's crashing or go crazy buying during bull runs (though I'm guilty of both, not gonna lie). Use the swings to your advantage with dollar-cost averaging and rebalance back to your target mix every so often. I check mine quarterly instead of obsessing daily - way less stressful and my returns are actually better.
So you've got four main buckets: stocks, bonds, real estate, and cash. Stocks are where the growth happens but they're wild rides. Bonds are the steady ones - less exciting but they pay you regularly. REITs let you dabble in real estate without buying actual property, which is pretty cool since they don't always tank when stocks do. Cash is super boring but you need it around for emergencies or when good opportunities pop up. How much of each depends on your age and how much volatility makes you want to throw up. Younger people can handle more stocks, older folks usually want more bonds. Figure out your percentages first, then rebalance every few months.
So age pretty much determines how much risk someone can handle and how long they've got to invest. Young people can go crazy with stocks - like 80-90% - since they have decades to recover from any crashes. Once you hit middle age, most folks pull back to around 60-70% stocks as retirement gets closer (though honestly some 50-year-olds invest like they're 25). Older investors usually want bonds and dividend stocks for steady income. But here's the thing - these are just rough guidelines. You've still gotta look at each person's specific situation and what they're actually comfortable with.
There's a few ways to handle rebalancing - you can do it on a schedule like quarterly or annually, or wait until your allocations drift 5-10% from your targets. Honestly most people way overcomplicate this. The scheduled approach is dead simple but you might miss big market swings. Threshold rebalancing catches those moves but means you're constantly checking your portfolio (which, let's be real, you probably are anyway). Here's a neat trick though - instead of selling stuff, just use new money to buy whatever's underweight. Way better for taxes. If you're just starting out, annual rebalancing works fine.
Look, macro data shows you where the economy's headed so you can tweak your portfolio. Rising inflation? Time to grab some commodities or TIPS. Strong GDP usually means stocks over bonds make sense. Interest rates are probably the biggest deal - they mess with bond prices and push money between growth and value stocks. Employment numbers lag behind everything else but still affect how much risk I'm willing to take. Honestly, the trick is ignoring the daily noise and just making small adjustments every few months based on the bigger trends.
So strategic allocation is basically your set-it-and-forget-it foundation - like that classic 60/40 stocks/bonds split you rebalance maybe once a year. Tactical is when you get clever and try timing the market a bit. You might overweight emerging markets during recoveries or pile into cash when recession warning signs pop up. Honestly, I've learned the hard way to keep tactical shifts small - maybe 5-10% max. Otherwise you'll mess up your whole long-term plan when you inevitably guess wrong on some moves. Nobody's got a crystal ball, right?
So you know how we all think we're geniuses when our stocks are up? That's overconfidence bias screwing with your head. We also get stuck on random price points and hate losing money way more than we like making it - totally normal human stuff. Here's what actually works: set up rules ahead of time for when you'll rebalance your portfolio. Dollar-cost averaging takes the guesswork out of timing. Maybe automate some of it if you're lazy like me. Trust me, you don't want to be that person selling everything when the market tanks.
Honestly, going international is one of the smartest moves you can make. Different countries don't always move together, so when the US tanks, Europe or Asia might be doing fine. You'll get exposure to sectors we don't really have here - like some of those crazy growth stories in emerging markets. Plus currency stuff can actually help when the dollar's weak (though that's kinda unpredictable). I'd start with maybe 20-30% in broad international ETFs. Nothing too fancy at first. Oh and don't overthink it - even just adding some developed markets helps break up that home bias we all have.
Honestly there's a bunch of good stuff out there now. For the big institutional players, Morningstar Direct and BlackRock's Aladdin are where it's at. Robo-advisors like Betterment handle the rebalancing automatically which is pretty sweet. Look, Excel still does the job if you're not fancy about it - I know people hate on spreadsheets but whatever works. Portfolio Visualizer gives you way better scenario testing though. Monte Carlo sims are clutch for stress testing your allocations. Personal Capital's actually free and tracks everything across accounts, so that's probably your best starting point unless you need something more complex.
Honestly, I'd use alternatives more like seasoning than the main course - they should complement your regular stocks and bonds, not take over. REITs, commodities, maybe some private equity if you're feeling fancy. The whole point is finding stuff that zigs when your other investments zag. Keep it under 20% of your portfolio though, especially starting out. These things can be weird to price and you can't always sell them quickly. I'd probably start with something simple like a commodity ETF or REIT just to see how it feels. Once you get comfortable, then maybe explore the fancier options.
Yeah so the upside is you can potentially make better returns by tweaking your portfolio when you spot opportunities or when things start looking sketchy. But here's the thing - it's way trickier than just buying and holding. Transaction costs add up fast, plus you'll get hit with more taxes from all that trading. And honestly? Most people suck at timing the market. You might end up doing the classic buy high, sell low thing if you read the signals wrong. If you're gonna try it, maybe start with like a small chunk of your money first - see how your gut instincts actually play out before betting the farm.
Track your portfolio's total return against a benchmark that matches your setup - so if you're doing 60/40 stocks/bonds, compare it to a 60/40 index. The Sharpe ratio is clutch for seeing if you're getting decent returns for the risk you're taking. Don't just chase returns though - volatility matters way more than people think. Check how much your allocation drifts from your target and rebalance when it gets too far off. I'd say quarterly reviews work best to keep yourself honest about sticking to the plan. Oh and honestly? Most people totally ignore the risk side of things.
No Reviews