


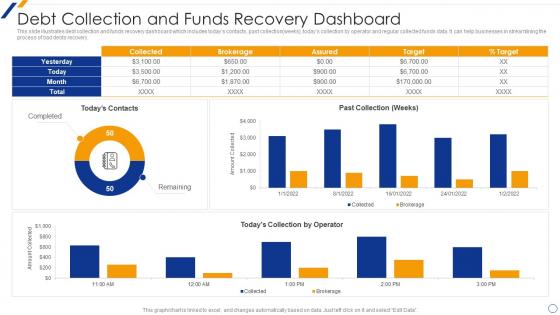
Debt Collection And Funds Recovery Dashboard Snapshot




Try Before you Buy Download Free Sample Product
 Impress Your
 Audience
 100%
100% Editable
 Save Hours
 of Time


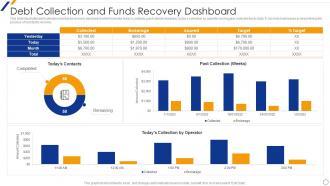
This slide illustrates debt collection and funds recovery dashboard snapshot which includes todays contacts, past collection weeks, todays collection by operator and regular collected funds data. It can help businesses in streamlining the process of bad debts recovery.
People who downloaded this PowerPoint presentation also viewed the following :
Debt Collection And Funds Recovery Dashboard Snapshot with all 7 slides:
Use our Debt Collection And Funds Recovery Dashboard Snapshot to effectively help you save your valuable time. They are readymade to fit into any presentation structure.





FAQs for Debt Collection And Funds
Start with collection rate - basically what you actually collected vs what was owed. DSO (days sales outstanding) is clutch too. Then check your aging buckets to see how long stuff's been sitting around. Recovery rates by collector will show you who's killing it and who needs help. Contact attempts and promise-to-pay conversion rates matter a bunch. Cost per dollar collected keeps you honest about ROI. Settlement rates tell you if your negotiation game is solid - honestly this one's underrated. Those basics will get you going. You can always add more weird metrics later once you figure out what your team actually cares about optimizing.
Look, debt recovery data is basically useless unless you can actually see what's happening. Charts and heat maps instantly show you which accounts are about to blow up, while trend lines tell you if things are getting better or worse. I swear, it's like finally putting on glasses after squinting at spreadsheets for months. Funnel charts are clutch too - they'll show you exactly where your deals keep dying. Start simple with a dashboard tracking recovery rates and aging buckets. You'll kick yourself for not doing this sooner.
Start with your CRM stuff - customer details, payment history, all that basic info. Collections activity comes next: call logs, payment promises, disputes. Your accounting system's aging reports are clutch for seeing what's actually outstanding. Email and SMS data helps if you're doing automated campaigns. Credit bureau info gives you the real picture of who'll actually pay (honestly saves so much time). The tricky part? Getting everything to sync up without conflicting data. Last thing you want is spending hours fixing numbers instead of collecting money!
Honestly, daily updates are the bare minimum for debt collection dashboards. Real-time is way better if you can swing it - this stuff moves crazy fast and old data will cost you money. Payment statuses flip constantly, new accounts drop in, aging buckets shift. I've seen teams do hourly batch updates as a compromise. Pick whatever frequency actually fits your workflow and don't bounce around - consistency matters more than you'd think. Start daily and bump it up if your portfolio's changing too quick. Real-time's obviously the gold standard though.
Dude, UX is huge for debt collection dashboards. Your collectors are under crazy pressure and need to move fast. When they're hunting around for basic info or can't figure out the interface, you're bleeding money. I've worked with some dashboards that looked slick but were absolute hell to use day-to-day - honestly, pretty interfaces mean nothing if they don't work. Put the critical stuff right up front. Make sure collectors can look at an account and instantly get what's happening. Keep clicks minimal. Test it with real users first, not just the IT team who built it.
Honestly, debt collection dashboards are game-changers for spotting payment patterns. Instead of drowning in spreadsheets (which nobody has time for), you get clear visuals showing when customers pay late. Seasonal stuff becomes obvious - like how Q4 always gets sketchy with payments. You'll notice which customer groups struggle most and whether your payment terms actually work. Net-30 customers? Usually way more problematic than net-15 ones. Set up alerts so you're not constantly monitoring everything manually. The visual trends help you tweak your collection approach before things spiral. Way better than playing catch-up later.
Start with the basics - split secured from unsecured debt, then add your 30-60-90+ day buckets. Credit cards need different handling than mortgages, so separate loan types make sense too. Honestly though, don't go crazy with subcategories if your team just focuses on "high priority" stuff anyway - I've seen that mistake before. Build your main groups first. Then you can always add filters later for when someone needs to dig deeper into specific accounts. The whole thing should match how people actually work, not some perfect system that looks good on paper.
Honestly, predictive analytics is a game-changer for debt collection dashboards. You'll stop working accounts randomly and start getting actual risk scores that show payment likelihood. The timing piece is huge too - it tells you when to contact people and what approach works best for different types of debtors. I'd start with propensity-to-pay scoring first since that gives immediate ROI on where your team should focus. Plus you get cash flow forecasting, which beats guessing at monthly targets. It's basically like having insider knowledge on which accounts will actually pay vs. the time-wasters.
Honestly, data privacy has to be your starting point here. Map out which regulations hit your specific debt types first - FDCPA, TCPA, plus whatever state rules apply. Your dashboard should only show users what they're legally allowed to see, period. Build in validation checks and alerts before collection practices cross any lines. That's way better than just reporting after the fact. Audit trails are boring but regulators eat that stuff up, so don't skip it. The whole thing should actually enforce compliance rules, not just track them after something goes wrong.
Yeah, most debt collection dashboards let you set different access levels for different roles. Collectors see account details and call logs. Managers get the big picture stuff - team metrics, portfolio overviews. Finance people need payment tracking and forecasts, obviously. What's nice is you can get pretty specific with permissions. Like someone can view reports but can't mess with account notes, or they access certain portfolios but not others. Honestly though, I'd figure out exactly what each role needs first. Otherwise you'll be constantly adjusting who can see what - learned that one the hard way.
Data integration is going to be your biggest headache, trust me. All your collection stuff is spread across different systems - CRM, payment platforms, legal software - and making them play nice together? Total pain. Real-time updates are tricky too since you don't want to blow your budget on API calls. Leadership wants fancy dashboards while your collection teams just need practical daily metrics. Oh, and honestly? Don't try to build everything at once. Pick one data source and a few key metrics first, then expand from there. Way less stressful that way.
Hook your dashboard up to APIs from payment processors, CRMs, and collection software so data flows in automatically. Schedule refreshes daily or hourly - whatever makes sense for your workflow. Honestly, the alerts are where things get really useful. Set them up for when accounts hit certain dollar amounts or missed payment promises. I'd start with your biggest data sources first, then add more over time (trust me, doing it all at once gets messy). You'll stop wasting hours updating spreadsheets and actually focus on collecting money instead.
React's probably your best bet for the frontend - most people know it and it handles real-time charts really well. Backend wise, I'd go with Node.js or Python (Flask/Django work great). PostgreSQL is solid for storing all the debtor data and payment histories. Oh and definitely throw Redis in there for caching since you'll be hitting the database a lot. For the actual charts, Chart.js is way easier than D3 unless you need something super custom. Honestly though, if you're starting fresh just go React + Node + PostgreSQL and you can't really go wrong.
A good dashboard shows you what's actually moving the needle instead of just eating your budget. You'll spot trends fast - like which customers respond better to calls versus emails, peak contact times, that sort of thing. Way better than drowning in Excel sheets (been there!). The magic happens when all your data lives in one spot so you can pivot quickly. I'd set up alerts for your main KPIs and check weekly. Catching problems early saves you from expensive headaches later. Plus you can see which debt ages are worth chasing versus total lost causes.
So definitely keep tabs on your bounce rates - when those spike, your data's probably getting stale. Recovery rates dropping? Time to switch up your strategy. I'd also watch how long cases are taking to close because that number creeping up usually means something's getting stuck in your workflow. Compliance violations are honestly the worst thing to see climbing (nobody wants that headache). Dispute rates going up and low first-contact resolution are red flags too. Oh, and set alerts for this stuff - way easier than manually checking every week and catching problems when they're still manageable.
-
“Slides are formally built and the color theme is also very exciting. This went perfectly with my needs and saved a good amount of time.”
-
A fantastic collection of templates. I'll likely use this as my go-to resource for future templates and support.