


Debt restructuring and refinancing powerpoint presentation slides


Try Before you Buy Download Free Sample Product
 Impress Your
 Audience
Editable
of Time


Use our Debt Restructuring And Refinancing PowerPoint Presentation Slides to understand and implement the debt refinancing strategy and process. Showcase a detailed financial analysis of your income statement, balance sheet, cash flow statement, and key financial ratio using the debt rescheduling PPT templates. The alternative financing PowerPoint presentation represents a comparison of multiple options like merger and acquisitions, debt restructuring, financial reconstruction, and bankruptcy to overcome the poor financial condition. Using the mitigating PPT slideshow, follow the steps including stabilization, preparation, and implementation to easily take decisions on the transfer of an asset, exchange of equity, or increase payment time. The debt repaying PowerPoint designs also guide to identify the risks like employee layoff, non-compliance by creditors, and restructuring framework to develop mitigation strategies. The presentation also creates a dashboard for the creditors and other aspects like total assets, cost of maintenance, and procurement cost for the exchange of debt.
People who downloaded this PowerPoint presentation also viewed the following :
Content of this Powerpoint Presentation
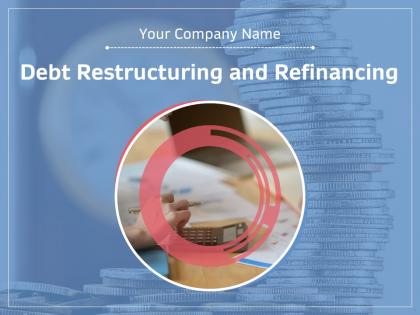
Slide 1: This title slide introduces Debt Restructuring and Refinancing. Add the name of your company here.
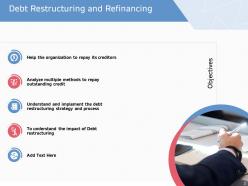
Slide 2: This slide presents the Objectives of Debt Restructuring and Refinancing. This includes: Analyze multiple methods to repay outstanding credit, Understand and implement the debt restructuring strategy and process, Help the organization to repay its creditors, Understanding the impact of Debt restructuring, etc.
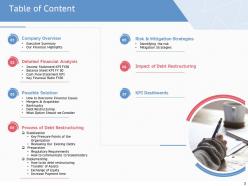
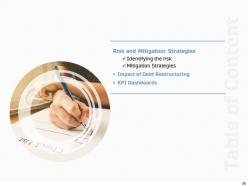
Slide 3: This slide contains the Table of Content. It includes: Company Overview, Detailed Financial Analysis, Possible Solution, Process of Debt Restructuring, Impact of Debt Restructuring, Risk & Mitigation Strategies, and KPI Dashboards.
Slide 4: This is a table of content slide showing the Company Overview. It includes: Executive Summary and Our Financial Highlights.
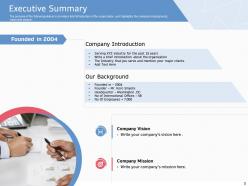
Slide 5: This slide presents the Executive Summary. It provides a brief introduction of the organization, as it highlights the company’s background, vision, and mission.
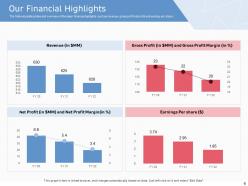
Slide 6: This slide presents the Our Financial Highlights. It prides over and overviews the major financial highlights such as revenue, gross profit net profit, and earning per share.
Slide 7: This is a table of content slide showing the Detailed Financial Analysis. This includes: Income Statement KPI FY20, Balance Sheet KPI FY 20, Cash Flow Statement KPI, and Key Financial Ratio FY20.
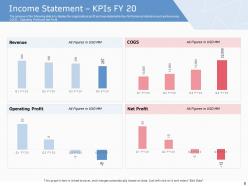
Slide 8: This slide presents the Income Statement – KPIs FY 20. It displays the organization's profit and loss statements Key Performance Indicators such as Revenues, COGS, Operating Profit, and Net Profit.
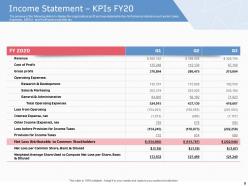
Slide 9: This slide presents the Income Statement – KPIs FY20. It displays the organization's profit and loss statements Key Performance Indicators such as Net Sales, Expenses, EBITDA, and Profit before and after-tax.
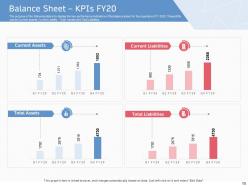
Slide 10: This slide presents the Balance Sheet – KPIs FY20. It displays the key performance indicators of the balance sheet for four quarters of FY 2020. These KPIs can be Current assets, Current Liability, Total Assets, and Total Liabilities.
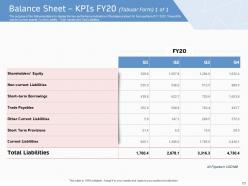
Slide 11: This slide presents the Balance Sheet – KPIs FY20 (Tabular Form) 1 of 1. It displays the key performance indicators of the balance sheet for four quarters of FY 2020. These KPIs can be Current assets, Current Liability, Total Assets, and Total Liabilities.
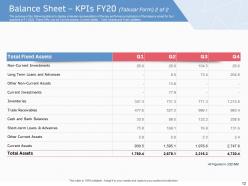
Slide 12: This slide presents the Balance Sheet – KPIs FY20 (Tabular Form) 2 of 2. It displays a tabular representation of the key performance indicators of the balance sheet for four quarters of FY 2020. These KPIs can be Current assets, Current Liability, Total Assets, and Total Liabilities.
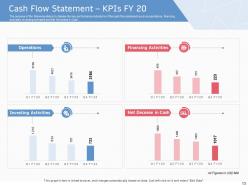
Slide 13: This slide presents the Cash Flow Statement – KPIs FY 20. It displays the key performance indicators of the cash flow statement such as operations, financing activates, investing activates, and Net Decrease in Cash.
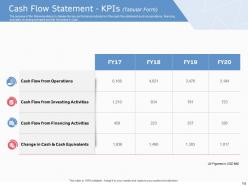
Slide 14: This slide presents the Cash Flow Statement - KPIs (Tabular Form). It displays the key performance indicators of the cash flow statement such as operations, financing activates, investing activates, and Net Decrease in Cash.
Slide 15: This slide presents the Key Financial Ratios FY20 (1/2). It displays the key financial ratios of the company for the year 2020, which indicates the financial performance of the organization.
Slide 16: This slide presents the Key Financial Ratios FY20 (2/2). It displays the key financial ratios of the company for the year 2020, which indicate the financial performance of the organization.
Slide 17: This is a table of content slide showing the Possible Solution. This includes: How to Overcome Financial Issues, Mergers & Acquisition, Bankruptcy, Debt Restructuring, and What Option Should We Consider.
Slide 18: This slide presents How to Overcome Financial Issues. It compares multiple options that the firm can consider in order to overcome poor financial conditions. These solutions can be mergers & acquisitions, Debt restructuring, Financial reconstruction, and Bankruptcy.
Slide 19: This slide presents the Mergers and acquisitions. It analyzes merger and acquisition as an option for the organization to repay the bad debts and overcome financial issues that the firm has been facing. The provided timeline analyses the process timeline of the merger process and the graph analyses the success rate in the market.
Slide 20: This slide presents Bankruptcy. It analyzes bankruptcy as an option for the organization to repay the bad debts and overcome financial issues that the firm has been facing. The provided graph analyses the success rate of this step.
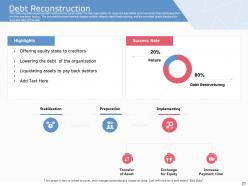
Slide 21: This slide presents Debt Reconstruction. It analyzes debt restructuring as an option for the organization to repay the bad debts and overcome financial issues that the firm has been facing. The provided process timeline displays multiple steps in debt Restructuring and the provided graph displays the success rate of this step
Slide 22: This slide presents the Why should we Consider Debt Restructuring? It analyzes bankruptcy as an option for the organization to repay the bad debts and overcome financial issues that the firm has been facing. The provided graph analyses the success rate of this step.
Slide 23: This is a table of content slide showing Implementing Debt Restructuring. This includes: Stabilization, Preparation, and Implementing.
Slide 24: This slide presents the Process of Debt Restructuring. It shows three key stages of the process of debt Restructuring that are stabilization, preparation, and restructuring.
Slide 25: This is a table of content slide showing Stabilization.
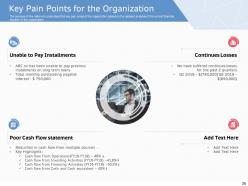
Slide 26: This slide presents the Key Pain Points for the Organization. It helps us to understand the key pain areas of the organization based on the detailed analysis of the current financial situation of the organization.
Slide 27: This slide presents the Reviewing Existing Debts. It analyzes and reviews the multiple debtors of the organization based on the total amount of credit that is due, the interest rate for these debts, EMIs per month, time period, and the security issued against the loan.
Slide 28: This is a table of content slide showing Preparation.
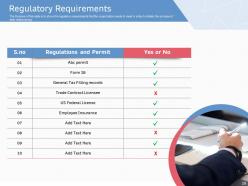
Slide 29: This slide presents the Regulatory Requirements. It shows the regulatory requirements that the organization needs to meet in order to initiate the process of debt restructuring.
Slide 30: This slide presents How to Communicate with Our Stakeholders. It shows the regulatory requirements that the organization needs to meet in order to initiate the process of debt restructuring.
Slide 31: This is a table of content slide showing Restructuring.
Slide 32: This slide presents the Implementing Debt Restructuring. It shows the 3 major ways in which debt restructuring can be implemented.
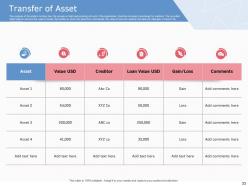
Slide 33: This slide presents the Transfer of Assets. It shows how the process of debt restructuring will work if the organization transfers its asset in exchange for creditors.
Slide 34: This slide presents the Exchange for Equity. It shows how the process of debt restructuring will work if the organization exchanges its equity for credit.
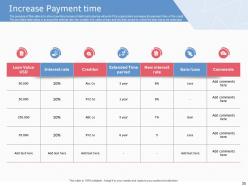
Slide 35: This slide presents the Increase Payment time. It shows how the process of debt restructuring will work if the organization increases the payment time of the credit.
Slide 36: This is a table of content slide showing the Risk and Mitigation Strategies. This includes: Identifying the risk, Mitigation Strategies, Impact of Debt Restructuring, and KPI Dashboards.
Slide 37: This slide presents the Challenges in Debt Restructuring. It analyzes the impact of the and likelihood and impact of various risks that may occur during the process of debt restructuring.
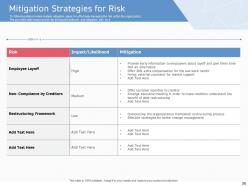
Slide 38: This slide presents the Mitigation Strategies for Risk. It analyzes the risk its Impact/Likelihood and the mitigation plan for it.
Slide 39: This slide presents the Impact of Debt Restructuring. It displays the impact of the debt restructuring on the organization as the provided graph shows the forecasted creditors and losses for the next 4 years.
Slide 40: This slide presents the Dashboard for Creditors. It shows the various KPIs that are used to measure the creditors of the organization such as Age summary, Credit Dyas, and purchase vs Paid Graph.
Slide 41: This slide presents the Total Organization Assets. It analyzes multiple assets of the company that can be used by the organization in exchange for debt. This slide analyses the procurement cost of the major asset and their cost of maintenance.
Slide 42: This is the Debt Restructuring and Refinancing Icons Slide.
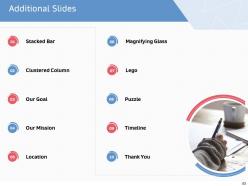
Slide 43: This slide introduces the Additional Slides. This includes: Stacked Bar, Clustered Column, Our Goal, Our Mission, Location, Magnifying Glass, Lego, Puzzle, Timeline, and Thank You.
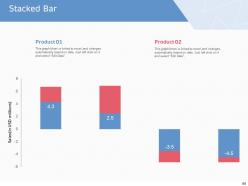
Slide 44: This slide shows a Stacked Bar that compares 2 products’ sales.
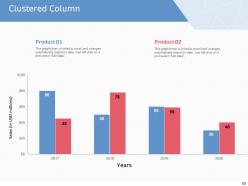
Slide 45: This slide shows a Clustered Column that compares 2 products’ sales over a timeline of years.
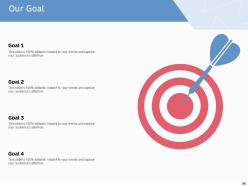
Slide 46: This slide presents the Our Goal of the company as well as smaller goals within that main goal.
Slide 47: This slide presents a comparison between the percentage of male and female users in the countries of the USA and China.
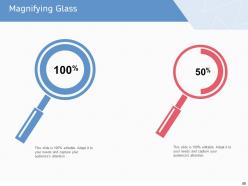
Slide 48: This slide presents a Magnifying Glass to give more details about the individual steps in a project.
Slide 49: This is the Lego slide that allows you to show the building blocks of a project or concept.
Slide 50: This is the Puzzle slide that allows you to show the components that complete a project or concept.
Slide 51: This slide is a Timeline template to showcase the progress of the steps of a project with time.
Slide 52: This is a Thank You slide where details such as the address, contact number, email address are added.
Debt restructuring and refinancing powerpoint presentation slides with all 52 slides:
Use our Debt Restructuring And Refinancing Powerpoint Presentation Slides to effectively help you save your valuable time. They are readymade to fit into any presentation structure.


FAQs for Debt restructuring and refinancing
So refinancing is when you're doing well financially and want better terms - like shopping for a lower rate or whatever. Restructuring is totally different though. That's when you're already struggling and can't make your payments, so you're basically begging your current lender to change the deal so you don't default. One's proactive, one's damage control. If you can refinance, do that instead - restructuring isn't fun and honestly makes you look desperate. But hey, sometimes life happens and you gotta do what you gotta do.
Check your debt service coverage ratio first - if you're below 1.25x or cash flow's getting sketchy, that's bad news. Covenant violations are another big warning sign. The real question though? Can you actually make payments for the next year without panicking every month. Most companies I've seen wait way too long to deal with this stuff - like they're in denial or something. Run some scenarios with different revenue numbers and figure out your breaking point. Trust me, restructuring before you're desperate is so much easier than scrambling later.
Look, debt restructuring is basically your lifeline when things get bad. Lower payments, longer terms, sometimes they'll even cut the total amount you owe. Your cash flow improves immediately, which is huge. Beats bankruptcy by a mile - way cheaper and you stay in control instead of courts taking over. Creditors actually prefer this too since they'd rather get something than watch you crash and burn completely. Oh, and it keeps your business relationships from going nuclear. Start with your biggest debts first when you approach people.
Honestly, get a financial advisor involved before you try handling this alone. They'll dig into your debt situation and cash flow to build a plan that actually makes sense. When you're dealing with lenders, they know exactly what to say - it's like having someone who speaks banker fluency. Plus they can spot refinancing options you'd probably miss and negotiate way better terms than most of us could on our own. I mean, these conversations can get pretty technical fast. Start early though, don't wait until you're already deep in negotiations.
Look, your credit rating is basically everything when you're refinancing. Good rating? You'll get better rates and way more lenders fighting for your business. Bad rating means you're stuck paying more, but honestly the distressed debt guys can sometimes cut you deals on terms that regular banks won't touch. I'd figure out exactly where you stand first - like really dig into it - because that's gonna shape your whole approach. Strong rating lets you shop around and play hardball. Weak one means you gotta be more strategic about timing and who you even bother calling.
So there's a few different routes you can go. Payment deferrals are probably the easiest - just pushing back when stuff is due. You can also try getting your interest rates lowered or even principal haircuts where they'll accept less than what you actually owe. Term extensions help too since they spread things out and lower your monthly payments. Asset-based restructuring is another option - trading debt for equity or collateral. Oh, and "blend and extend" is pretty popular where you combine debts and stretch the timeline. Really depends on your situation though. I'd start by writing down all your debts and what the terms are, then see what makes sense for your cash flow.
Look, you're basically rewriting your debt deals, which can mess with compliance stuff and hit your credit. Document everything - lenders want bulletproof terms for new structures. Tax consequences are real too. Forgiven debt sometimes counts as income (learned that one the hard way). Your current contracts might have clauses that kick in during restructuring. Honestly? Get a debt attorney involved early. The paperwork will destroy you if it's not done right, and these guys know all the weird loopholes that can pop up.
Honestly, get ahead of this before rumors start flying. Call your creditors, investors, and employees first - don't wait for them to hear it through the grapevine. Lay out what's happening, your restructuring plan, and realistic timelines. I've watched too many companies crash and burn by staying quiet too long. Even when there's no big updates, keep communicating regularly. Silence freaks people out way more than bad news does, trust me. Set up regular investor calls or stakeholder meetings. Bad news they can handle - being left in the dark? That's when they panic.
Look for companies with massive fixed costs - retail, hospitality, airlines, energy, manufacturing. Airlines are honestly the worst offenders, they restructure constantly. Real estate and hospitals get hit hard too, especially when reimbursement rates change. Mining and construction are cyclical nightmares. Basically any business that needs tons of upfront capital and has heavy debt loads becomes a target when cash flow dries up. Oh, and avoid anything that can't pivot quickly during downturns - those rigid cost structures will crush them.
Check your finances first - if you've got decent credit and steady income, refinancing's probably your move. Already behind on payments? Go with restructuring instead. Refinancing won't cut what you owe, but man, those lower rates add up to real savings. Restructuring might actually reduce your principal or give you more time, though your credit will take a hit. There's costs either way - refinancing has upfront fees, restructuring might mess with your taxes. Rates dropped and you're current? Refinance. Drowning in debt? Restructure before you start missing payments and things get ugly.
Honestly, tech makes debt restructuring way less painful than it used to be. There's software now that pulls all your debt data into one place and runs scenarios automatically - cuts weeks of work down to days. Excel add-ins can handle the complex math if you don't want fancy platforms. The communication part with creditors gets easier too since everything's organized. I'd start with debt management software, though some of the Excel tools are surprisingly good. Way better than doing spreadsheets manually and making calculation mistakes. Plus you can actually see which restructuring options might work before committing.
Watch out for interest rate changes and longer payment terms - they'll jack up your total costs even if monthly payments drop. Your assets might be on the hook as collateral too. Prepayment penalties on your current debt can be nasty, honestly depends what you signed originally. Market timing's tricky since things can shift while you're mid-process. Don't get sucked into just looking at lower monthly payments though. Run the real numbers on total interest over the loan's life. I've seen too many people get burned focusing on that smaller monthly number without doing the math.
So debt restructuring is basically renegotiating with your creditors to get better terms. You can push out payment dates, get lower interest rates, maybe even convert some debt to equity. The whole point is freeing up monthly cash flow - instead of everything going to debt payments, you actually keep some money in the business. Sometimes creditors will forgive part of what you owe if they think it beats you defaulting entirely. Honestly, timing matters huge here. Don't wait until you're drowning - approach them early when you're still looking responsible and proactive. They'll actually want to help you then.
When the economy tanks, you've gotta think outside the box with debt stuff. New credit basically dries up, so forget about just refinancing at better rates. Payment deferrals work well. Interest cuts too. Sometimes you can even swap debt for equity - though that gets messy fast. Here's the weird part: creditors actually become more flexible because they'd rather work with you than watch you crash and burn. My cousin learned this the hard way in 2020. Don't wait until you're drowning to start these talks. Call them early while you still have options.
Loan covenants are basically rules you have to follow after refinancing - stuff like maintaining certain debt ratios or hitting cash flow minimums. Your lender might also want approval before big acquisitions. They can feel pretty limiting, but here's the thing: you can negotiate them during refinancing talks. Push back on anything that'll mess with your day-to-day operations. Most lenders just want reassurance you won't tank the business (fair enough, I guess). Just make sure your lawyer reviews everything before you sign. Don't let them box you in too much.
-
Excellent work done on template design and graphics.
-
Great quality product.
-
Content of slide is easy to understand and edit.