

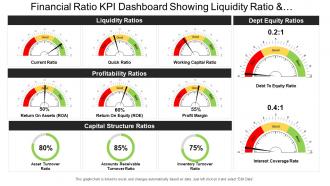
Financial ratio kpi dashboard snapshot showing liquidity ratio and profitability ratio






Try Before you Buy Download Free Sample Product
 Impress Your
Audience
 100%
Editable
 Save Hours
of Time


Our Financial Ratio Kpi Dashboard Snapshot Showing Liquidity Ratio And Profitability Ratio contain impressive imagery. Guaranteed to generate a huge impact.
People who downloaded this PowerPoint presentation also viewed the following :
Financial ratio kpi dashboard snapshot showing liquidity ratio and profitability ratio with all 6 slides:
Explain how to enter the information with our Financial Ratio Kpi Dashboard Snapshot Showing Liquidity Ratio And Profitability Ratio. Brief folks about the form.


FAQs for Financial ratio kpi dashboard snapshot showing liquidity ratio
So financial ratios are just math comparisons from your company's statements - profit margins, debt ratios, that stuff. They're clutch for spotting trends and seeing how you stack up against competitors. Think of it like getting bloodwork done, but for your business. You can catch problems early (cash flow's always the sneaky one) or discover you're actually crushing it somewhere unexpected. I'd honestly just pick 3-5 ratios that make sense for your industry and check them monthly. Don't overthink it - consistency beats perfection here.
So basically, liquidity ratios tell you if a company can cover its bills for the next year without panicking. Current ratio divides current assets by current liabilities - you want it above 1.0, but not crazy high since that might mean they're just sitting on cash instead of doing anything smart with it. Quick ratio's tougher because it cuts out inventory (which honestly can be a pain to sell fast). I'd check these monthly if you're really following a company. They're like your early warning system before things go sideways with cash flow.
So profitability ratios are basically how you figure out if a company's actually making decent money from what they put in. Look at gross profit margin, operating margin, net profit margin - that stuff shows how much they're keeping from every dollar that comes in. Higher margins usually mean they're running things well, though sometimes they just have crazy good pricing power (nice problem to have, right?). The real trick is watching how these change over time and comparing to their competitors. Oh, and if you see margins going up each quarter? That's when you know management's getting their act together operationally.
So solvency ratios show whether your company can actually pay off its long-term debt without crashing and burning. You're looking at stuff like debt-to-equity and times interest earned - basically what you owe vs. what you've got coming in. It's like making sure you can handle your mortgage for the next 30 years, not just scraping by this month. Honestly, these ratios are lifesavers for catching cash problems early. When they start dropping, that's your cue to either cut debt or find ways to make more money - and fast.
So quick ratio is basically the paranoid version of current ratio lol. Current ratio takes all your assets that should turn into cash soon - inventory, receivables, actual cash - and divides by what you owe short-term. Quick ratio? It's way pickier. Tosses out inventory completely since that stuff can sit around forever if nobody's buying. Only counts cash and receivables - the things that'll actually become money fast. Honestly both are useful though. If there's a huge difference between the two numbers, you've probably got way too much product just sitting there collecting dust.
So the debt-to-equity ratio shows how much debt a company has versus what shareholders own. Calculate it by dividing total debt by total equity. Above 1.0? They're borrowing more than they have in equity, which gets sketchy if profits tank. Utilities always run high ratios though - that's just how they operate. Most other companies shouldn't be crazy high. Honestly, the number by itself doesn't mean much. You've gotta compare it to similar companies in the same industry to know if it's actually bad or not.
So efficiency ratios are what you want to look at when figuring out if a company's actually good at using what they have. Things like inventory turnover, receivables turnover, asset turnover - they tell you if management can turn stuff into sales and collect money fast. I always check these because honestly, a company can look profitable on paper but still suck at operations. If you see these ratios getting worse over time? That's usually the first sign management's losing control of the basics. Way more telling than just looking at profit margins, in my opinion.
So P/E ratios are basically what people will pay for each dollar of earnings. High P/E means investors are feeling good about growth potential - they're betting big on the future. Low P/E? Either the stock's beaten down or people think growth is done. It's honestly like a popularity contest sometimes. But you can't just compare random companies - a tech stock will always have a higher P/E than something boring like utilities. Stick to comparing within the same industry, otherwise you're comparing apples to oranges and won't learn much.
Dude, if you're at a startup, burn rate is literally life or death - track that first. Customer acquisition cost and runway matter too, plus revenue growth to show you're not building something nobody wants. Mature companies? They've got actual assets to work with, so focus on ROE, debt-to-equity ratios, current ratio - the boring but important stuff. It's wild how different the priorities are. Startups are basically asking "will we survive next quarter?" while established companies are optimizing what they've already built. Seriously though, don't get fancy with metrics if you're early stage and bleeding cash.
So basically, comparing your ratios to competitors shows you where you're killing it and where you're falling behind. If your debt-to-equity is way worse than everyone else's, probably not the best time to take out a huge loan for expansion - fix your balance sheet first. You can also figure out which companies are crushing it efficiency-wise and steal some of their strategies (legally, obviously). Short version: use these comparisons to decide where to actually spend your time and money instead of just guessing. It's like having a roadmap for what to prioritize next.
Look, financial ratios are super useful but they've got some major blind spots. Most are backward-looking, so good luck predicting what'll actually happen next quarter. Plus companies use different accounting tricks - makes comparing them a total headache. A ratio that screams "disaster" in one industry might be perfectly fine in another. And honestly? They miss all the human stuff that really matters - like whether the CEO knows what they're doing or if the whole market's about to tank. My advice: never trust just one ratio. Use several and stack them against industry averages.
So basically you'll want to convert all those old numbers to today's dollars using CPI before you even start calculating ratios. Otherwise you're not seeing the real story - just nominal values that don't mean much. Like with ROE analysis over time, adjust each year's equity first. Makes such a huge difference honestly. Your trends will actually make sense instead of being all wonky from inflation effects. I'd focus on the real growth ratios and inflation-adjusted margins. That's where you'll see what's genuinely happening with performance versus just... numbers going up because everything costs more now.
So tech benchmarks are kinda all over the place, but here's what you should look at: current ratio should be around 2-4x since these companies hoard cash like crazy. Gross margins for software? You're looking at 60-80%. Most tech firms keep debt-to-equity under 0.3 because they don't need tons of equipment. ROE usually hits 15-25%, though high-growth companies will burn cash for a while. P/E ratios are honestly a mess - anywhere from 20-50x depending on where they are growth-wise. But here's the thing - SaaS companies look totally different from hardware guys. I'd pull some 10-Ks from your main competitors to get better comps for your specific space.
Timing is everything with financial ratios - they can totally mislead you during seasonal swings. A retailer's current ratio looks awful in Q1 after burning cash on holiday inventory, but fantastic by Q4 when sales roll in. Working capital and profit margins bounce around the same way. Here's what actually works: compare this January to last January, not January to December. Rolling 12-month averages are even better since they smooth out the seasonal noise. Quarter-to-quarter comparisons are honestly pretty useless for most businesses. You'll get a way clearer picture of what's really happening financially.
Think of financial ratios like checking your pulse regularly instead of just once. Sure, one bad quarter happens to everyone. But when you're tracking quarterly and see liquidity dropping, debt piling up, or profit margins getting squeezed consistently? That's your real red flag right there. ROE tanking over time, current ratio sliding - those patterns expose the stuff a single snapshot totally misses. I always tell people to focus on the trend, not just the latest number. That's honestly where you'll catch the actual problems before they wreck you.
-
Informative design.
-
Enough space for editing and adding your own content.