Financial Report Of An Information Technology Company Complete Deck
A company profile is a professional introduction of a company to provide operational and financial information. Check out our professionally designed template for the Financial Report of an Information Technology Company that wants to give its business details to its stakeholders employees, investors, clients, partners, shareholders, etc. It covers the operation information such as a brief overview of the company and its products and services, history, geographic presence, mission and vision statement, latest technologies, research and development activities, distribution network, etc. In addition to this, it covers the competitor details such as the name of top competitors by their operations, competitive landscape, financial comparison with competitors, etc. The template has also covered the financial overview of the company that includes the company's financials from its income statement revenue, EBIT, and Net income, balance sheet total assets, total liabilities, goodwill, and cash flow statement cash flows from operating, investing, and financing activities. In the end, it covers strategic details long-term growth goals and strategies, acquisition details, SWOT analysis, and risk management strategies of the company. The module also covers the primary corporate social responsibilities of the company. Take advantage of our 100 percentage editable company profile, allowing you to tailor the content to your specific requirements. Benefit from our extensive research and skillfully designed product by downloading it now.
- Google Slides is a new FREE Presentation software from Google.
- All our content is 100% compatible with Google Slides.
- Just download our designs, and upload them to Google Slides and they will work automatically.
- Amaze your audience with SlideTeam and Google Slides.
-
Want Changes to This PPT Slide? Check out our Presentation Design Services
- WideScreen Aspect ratio is becoming a very popular format. When you download this product, the downloaded ZIP will contain this product in both standard and widescreen format.
-

- Some older products that we have may only be in standard format, but they can easily be converted to widescreen.
- To do this, please open the SlideTeam product in Powerpoint, and go to
- Design ( On the top bar) -> Page Setup -> and select "On-screen Show (16:9)” in the drop down for "Slides Sized for".
- The slide or theme will change to widescreen, and all graphics will adjust automatically. You can similarly convert our content to any other desired screen aspect ratio.
Compatible With Google Slides

Get This In WideScreen
You must be logged in to download this presentation.
PowerPoint presentation slides
This complete deck covers various topics and highlights important concepts. It has PPT slides which cater to your business needs. This complete deck presentation emphasizes Financial Report Of An Information Technology Company Complete Deck and has templates with professional background images and relevant content. This deck consists of total of fifty two slides. Our designers have created customizable templates, keeping your convenience in mind. You can edit the color, text and font size with ease. Not just this, you can also add or delete the content if needed. Get access to this fully editable complete presentation by clicking the download button below.
People who downloaded this PowerPoint presentation also viewed the following :
Content of this Powerpoint Presentation
Slide 1: This slide introduces Financial Report of an Information Technology Company. State Your Company Name and begin.
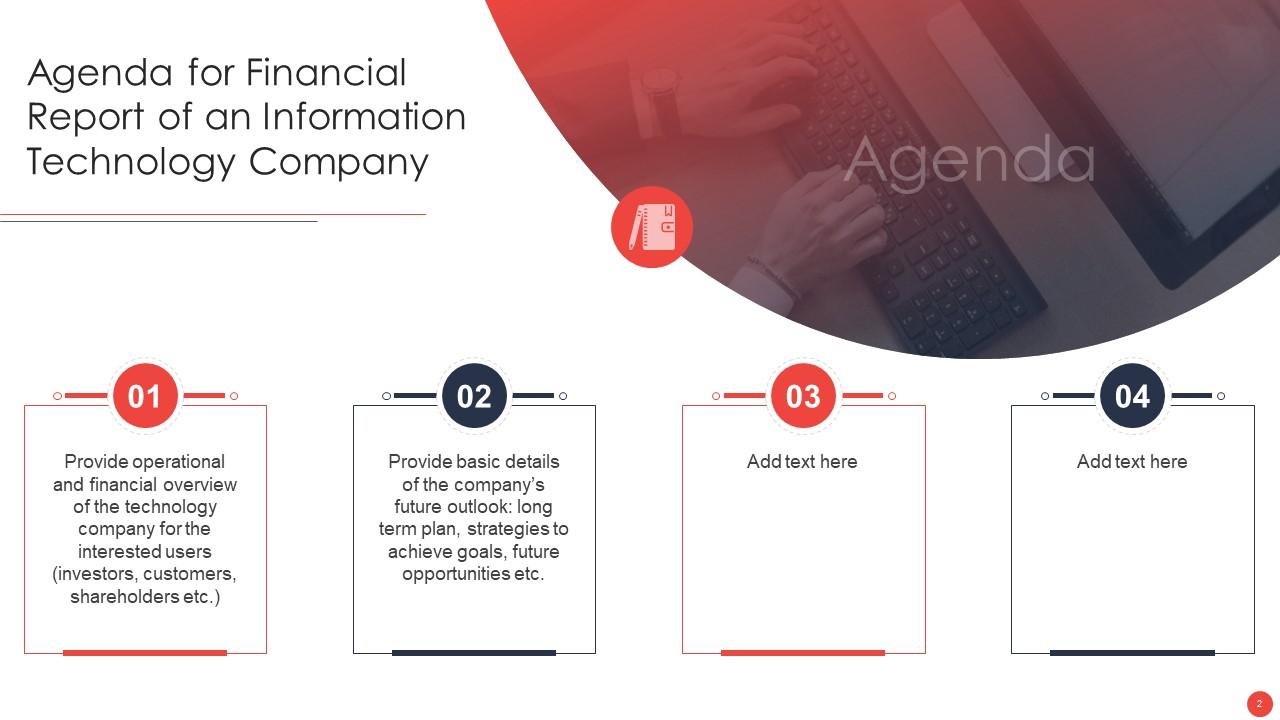
Slide 2: This slide states Agenda of the presentation.
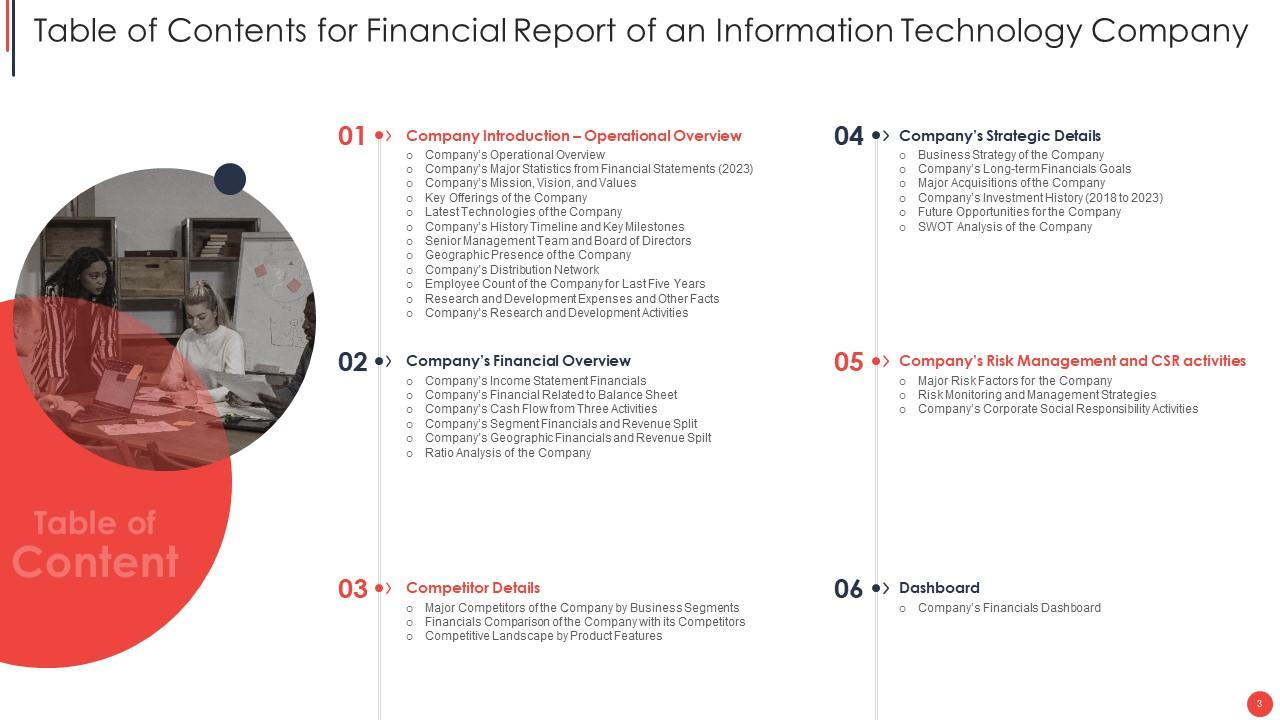
Slide 3: This slide presents Table of Content for the presentation.
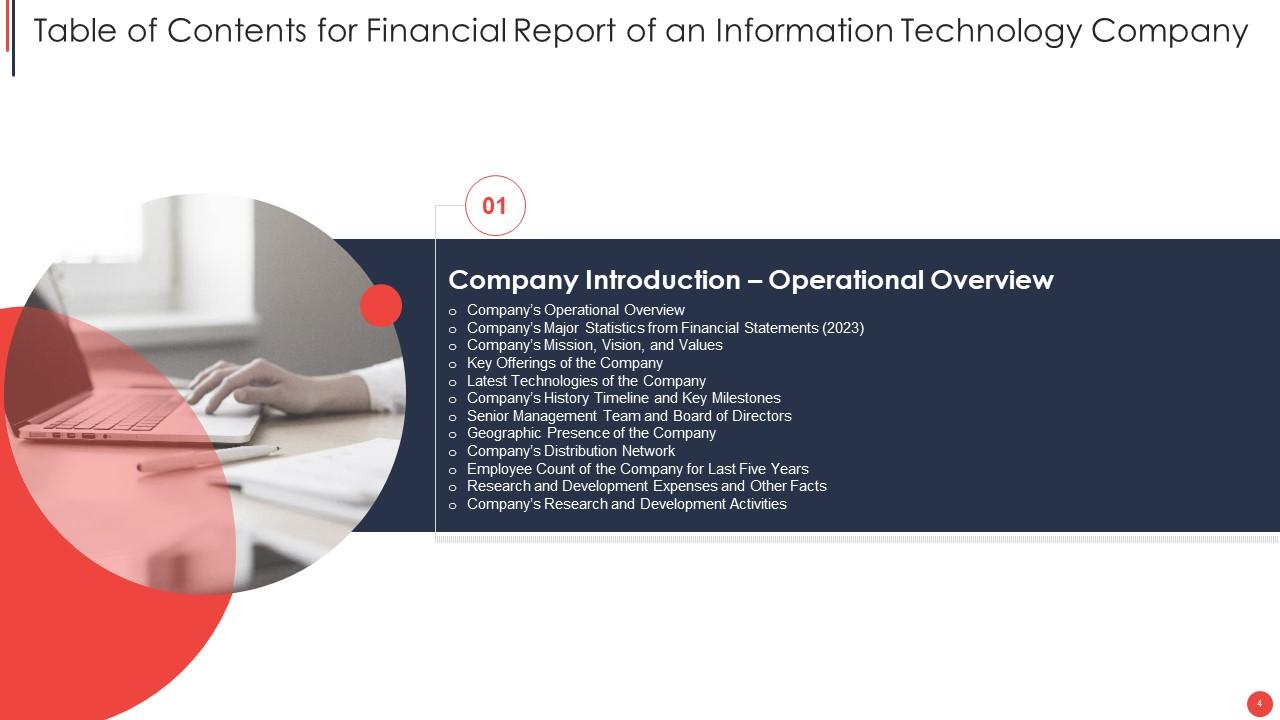
Slide 4: This slide highlights title for topics that are to be covered next in the template.
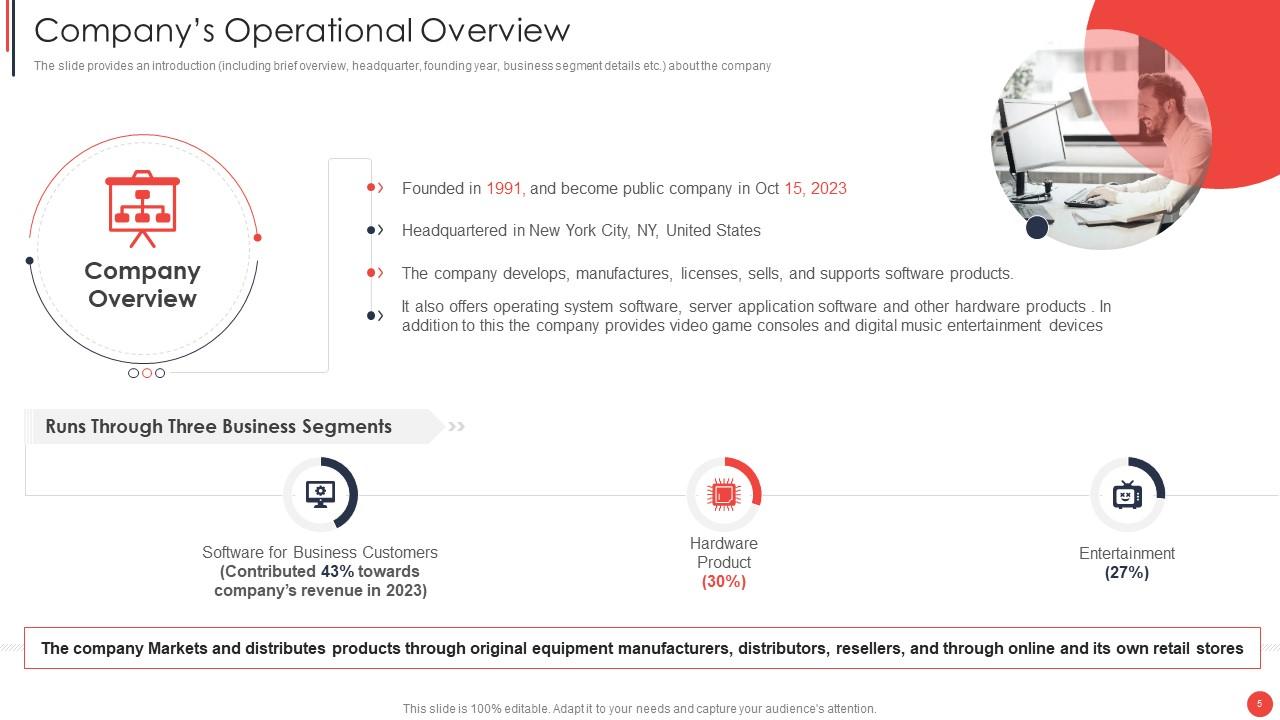
Slide 5: The slide displays an introduction including brief overview, headquarter, founding year, business segment details etc.
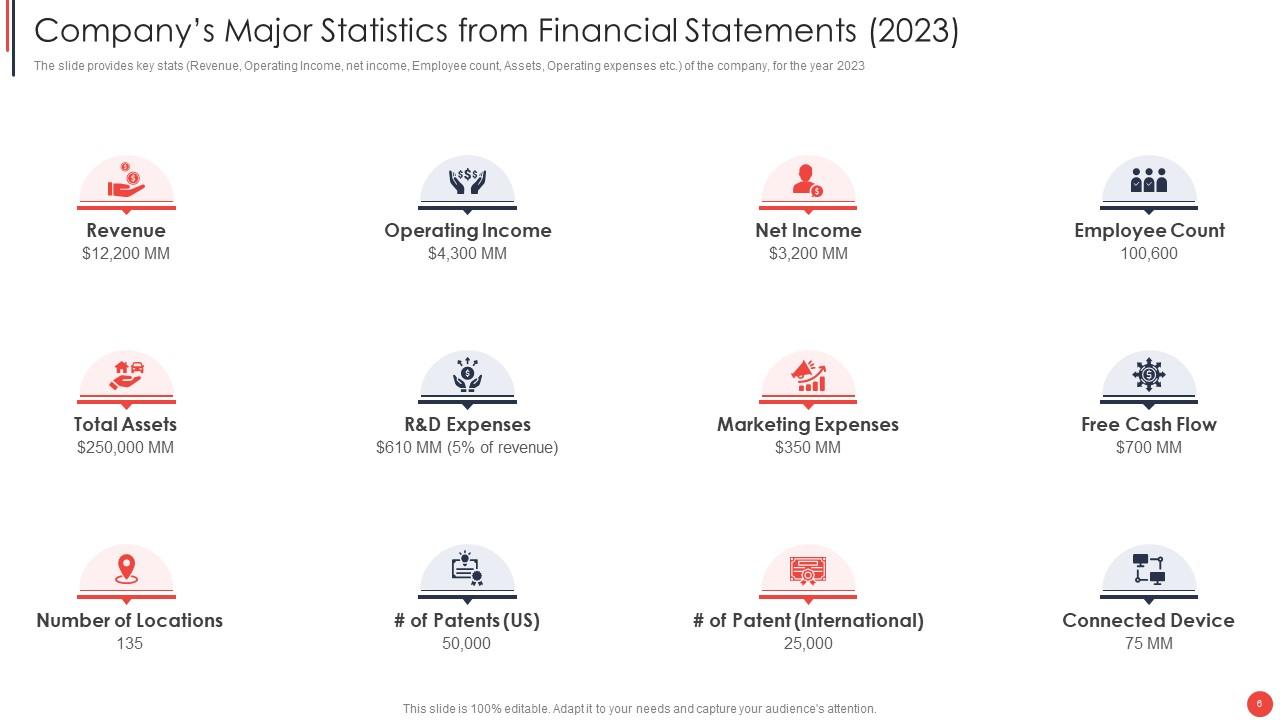
Slide 6: This slide represents Company’s Major Statistics from Financial Statements.
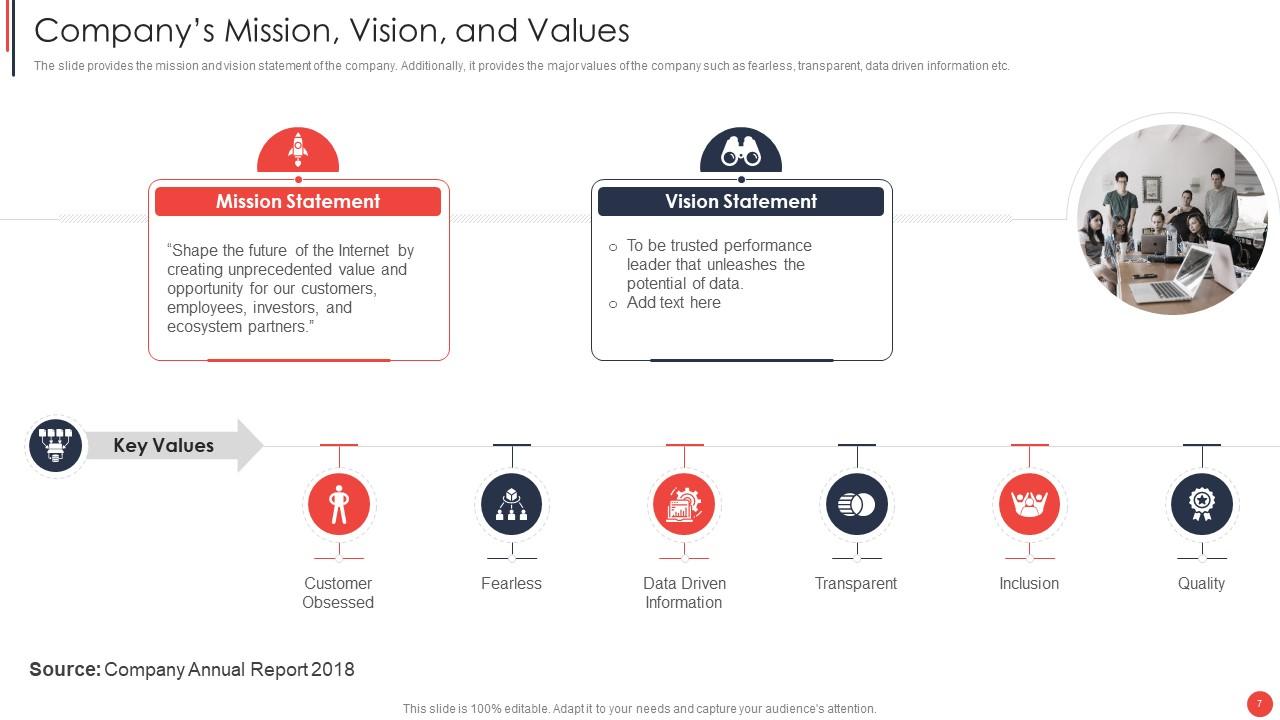
Slide 7: The slide provides the mission and vision statement of the company.
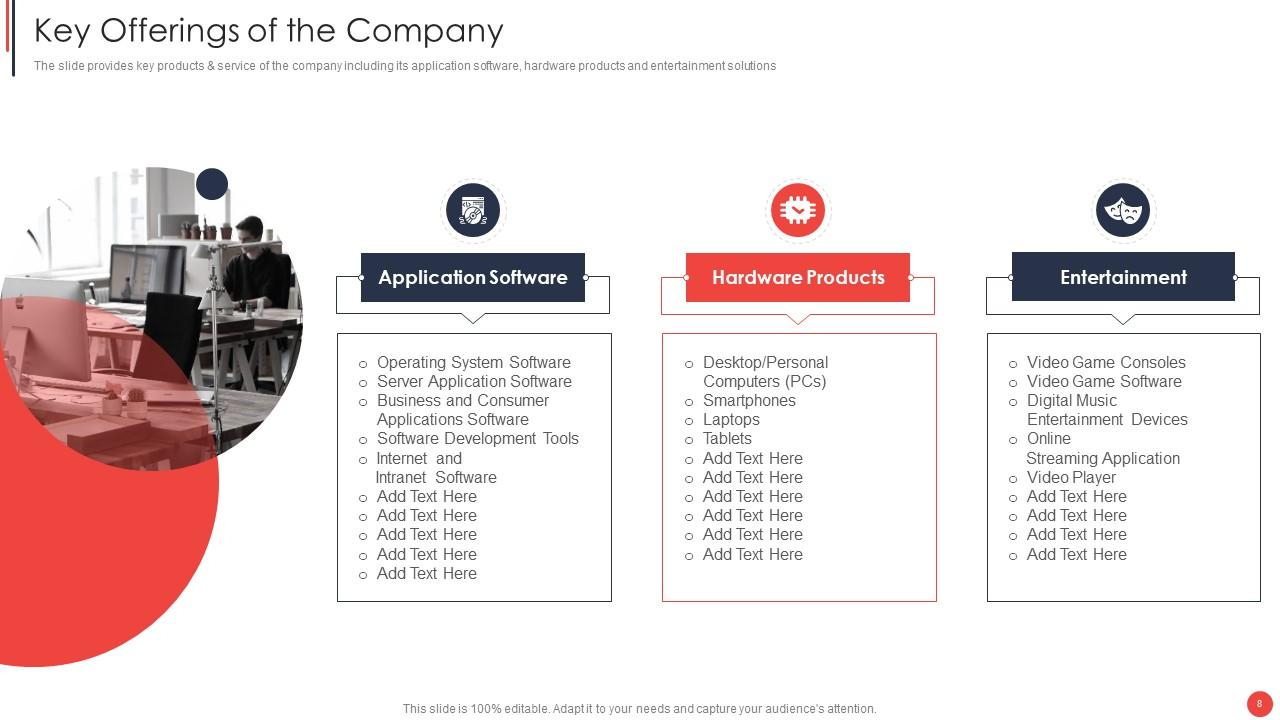
Slide 8: The slide presents key products & service of the company including its application software, hardware products and entertainment solutions.
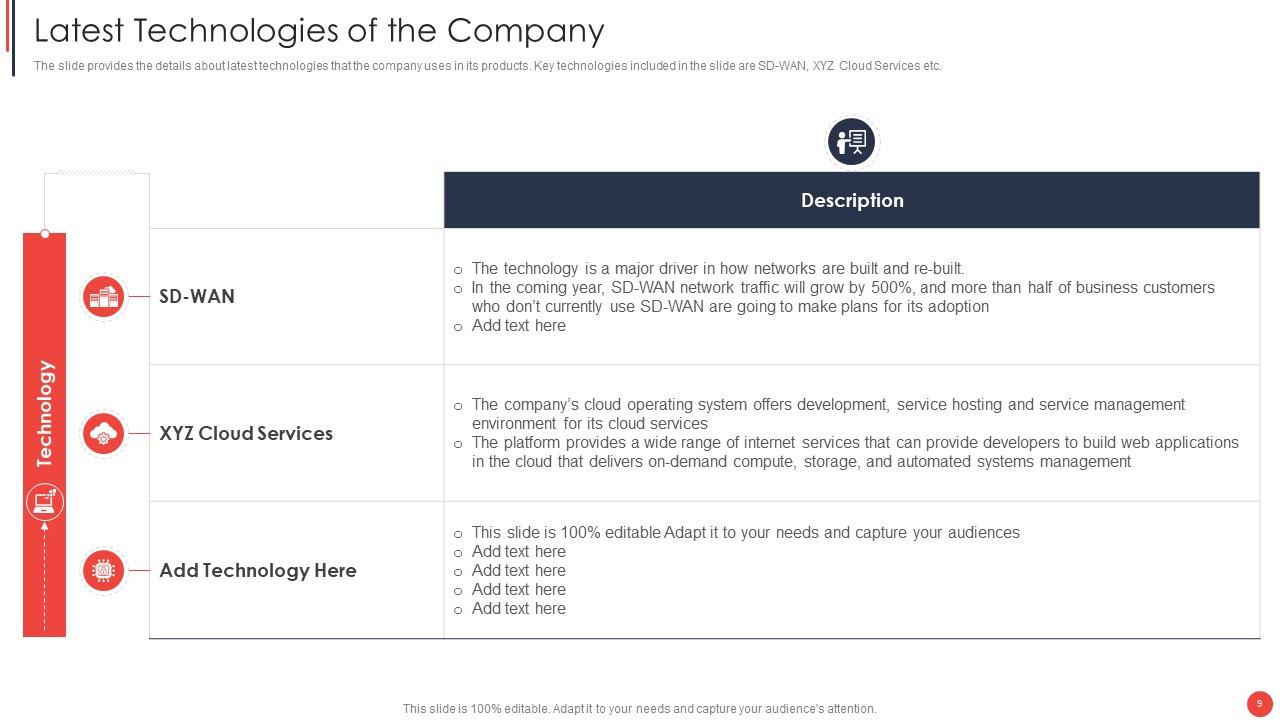
Slide 9: The slide displays the details about latest technologies that the company uses in its products.
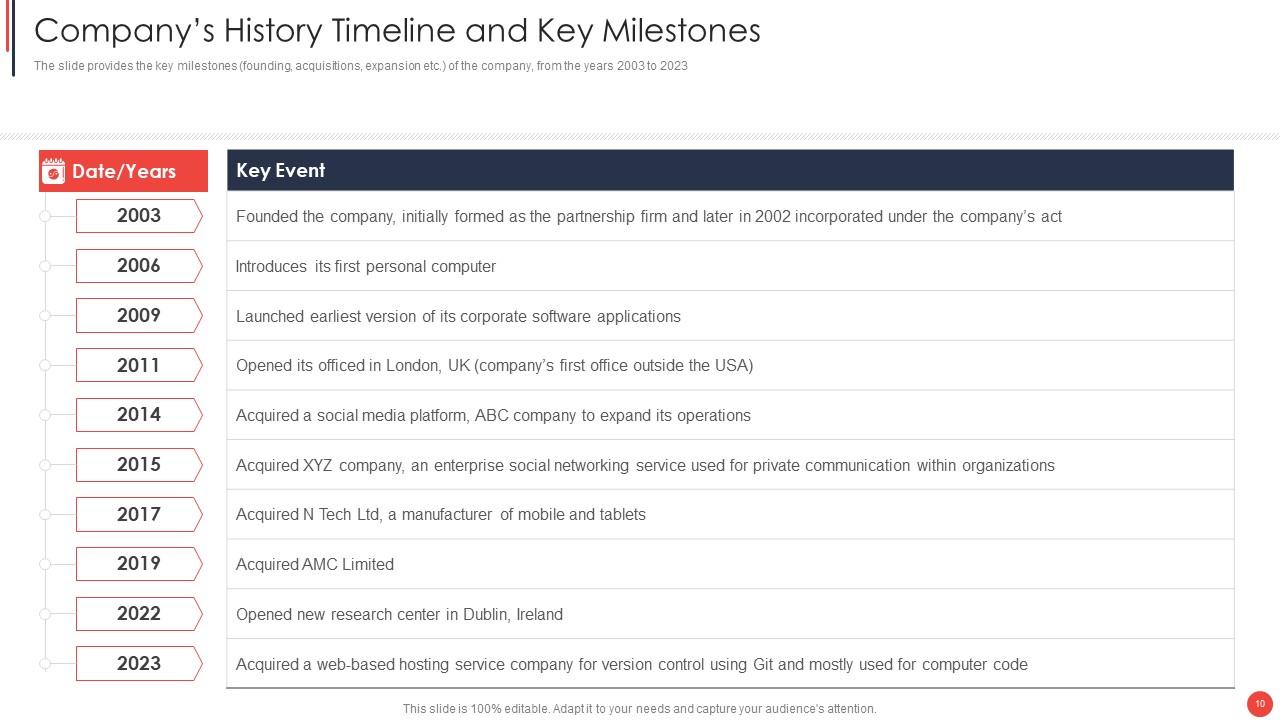
Slide 10: The slide represents the key milestones (founding, acquisitions, expansion etc.) of the company, from the years 2000 to 2020.
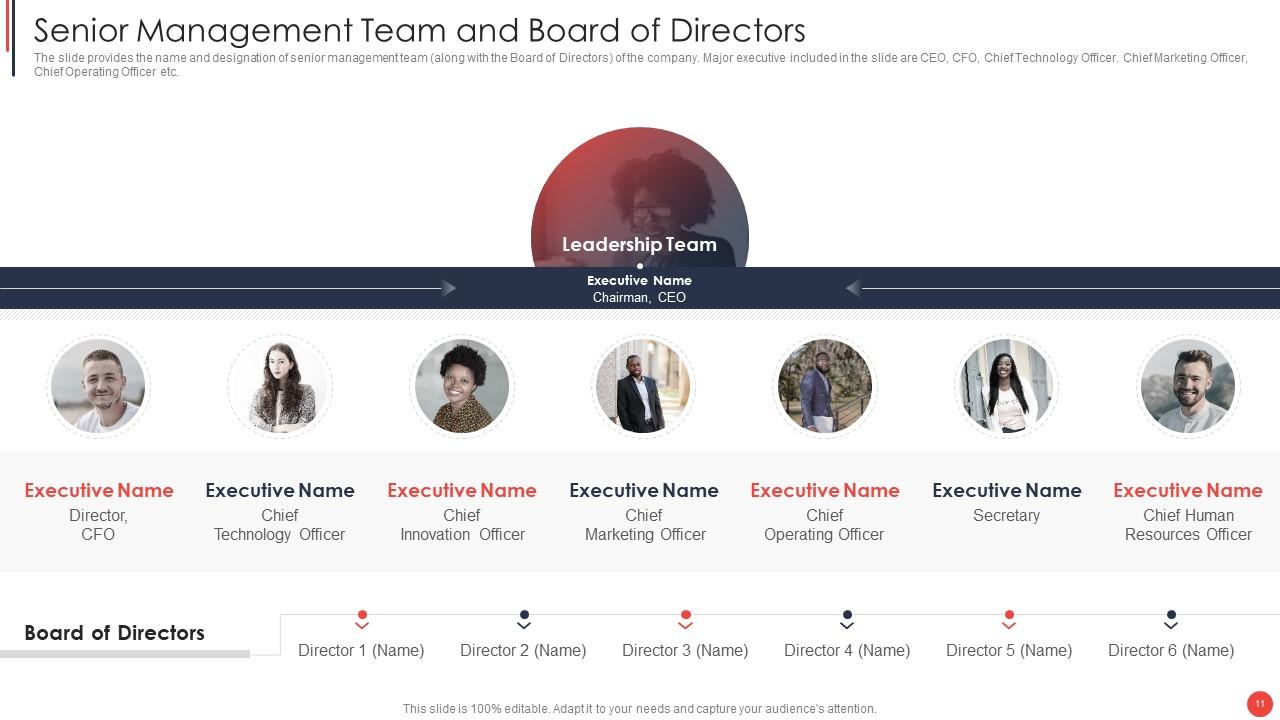
Slide 11: The slide provides the name and designation of senior management team (along with the Board of Directors) of the company.
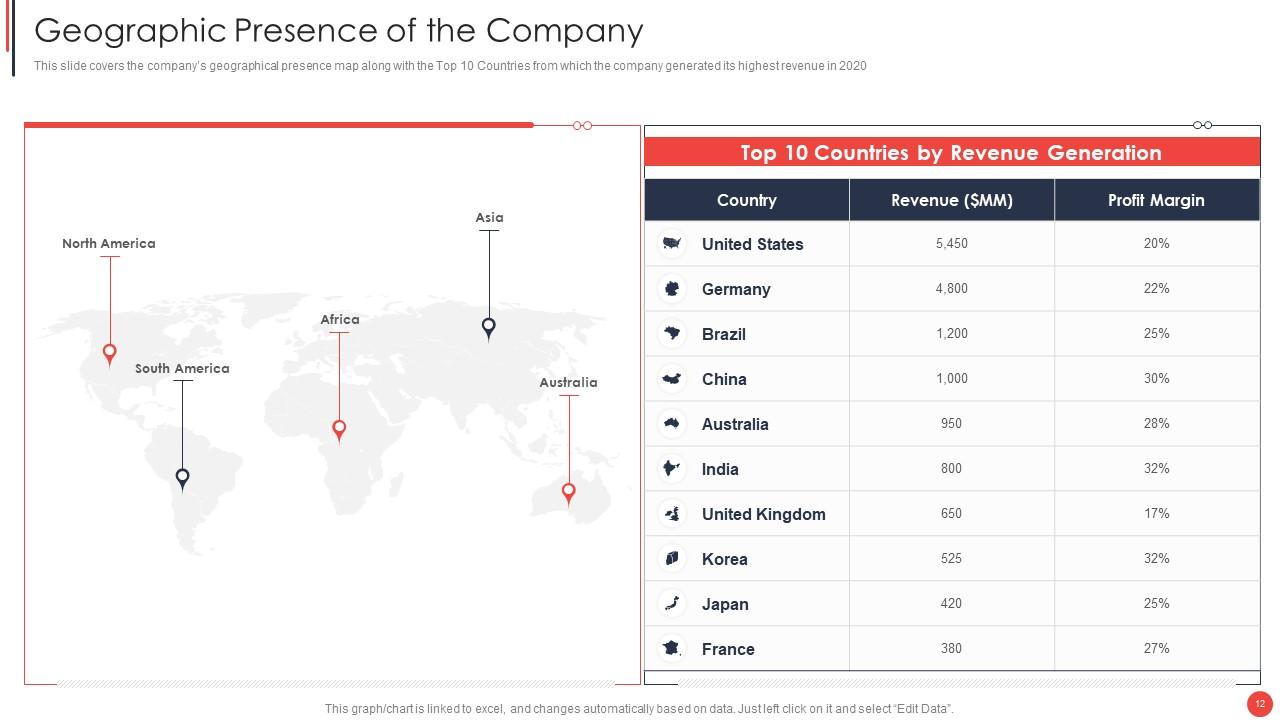
Slide 12: This slide covers the company’s geographical presence map along with the Top 10 Countries from which the company generated its highest revenue.
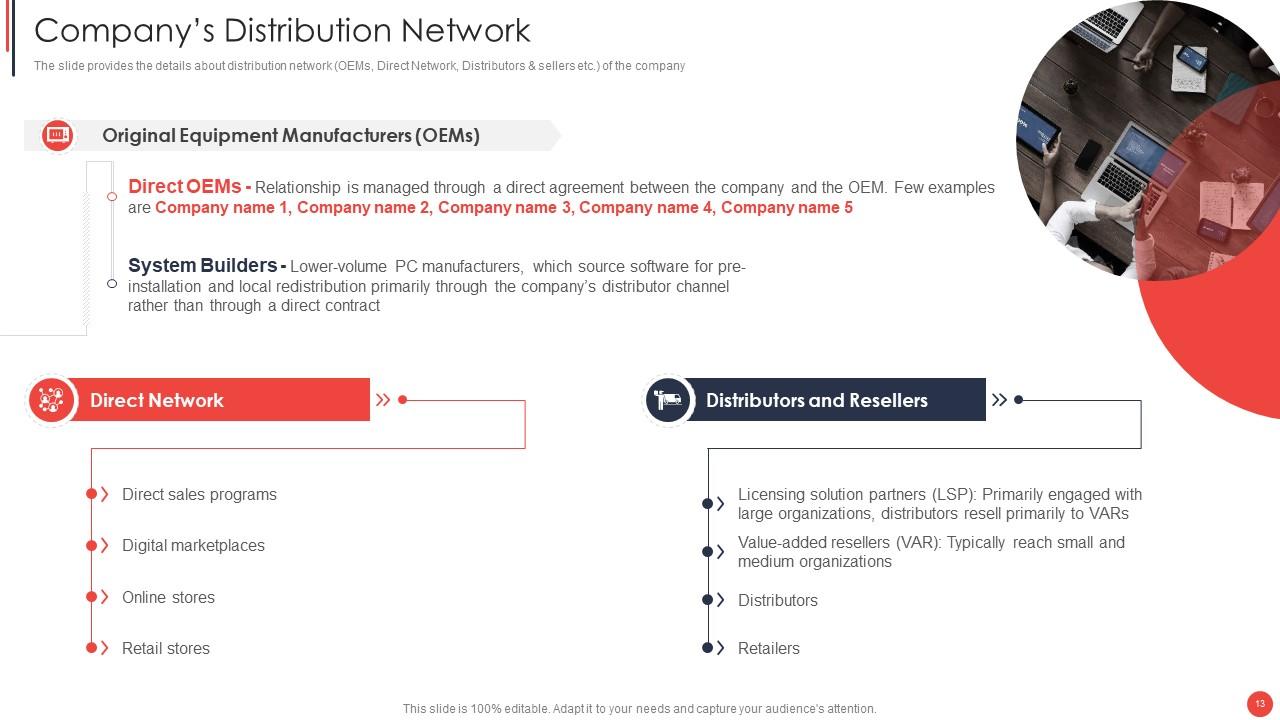
Slide 13: The slide represents the details about distribution network (OEMs, Direct Network, Distributors & sellers etc.) of the company
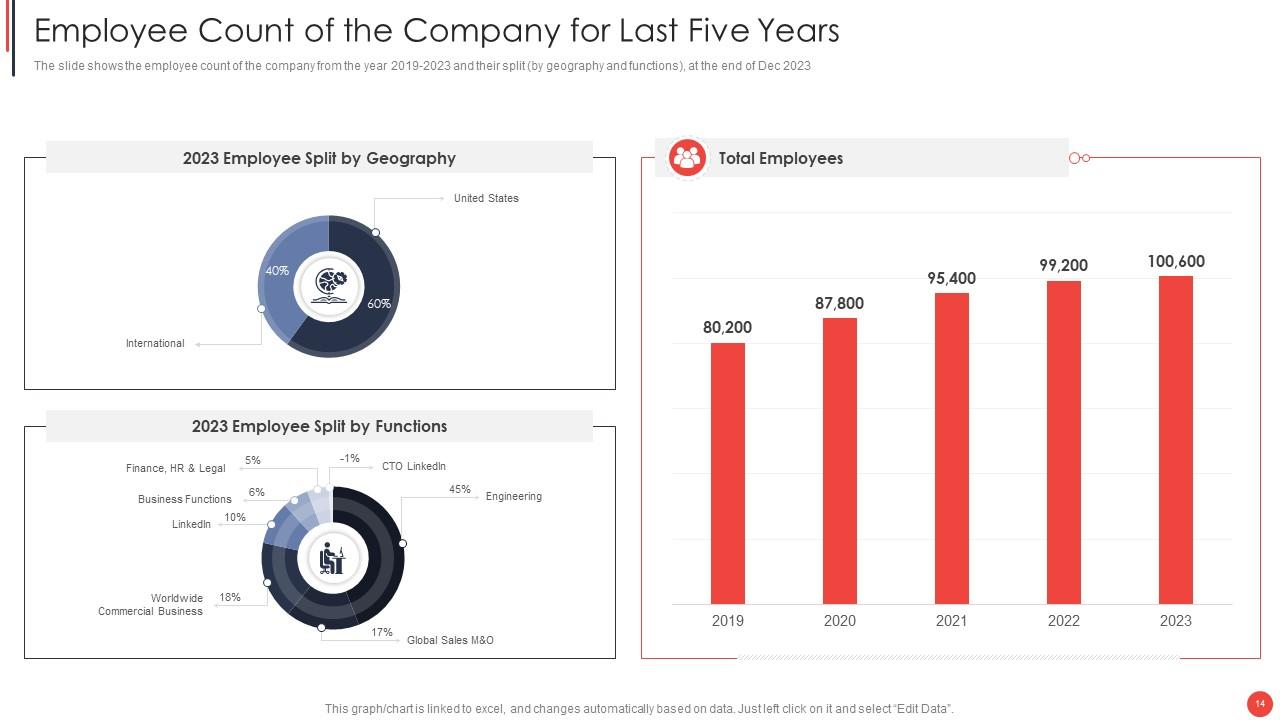
Slide 14: The slide shows the employee count of the company from the year 2017-2021 and their split (by geography and functions).
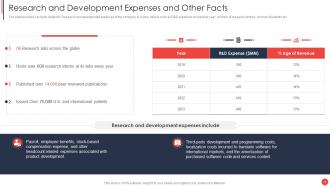
Slide 15: This slide presents Research and Development Expenses and Other Facts.
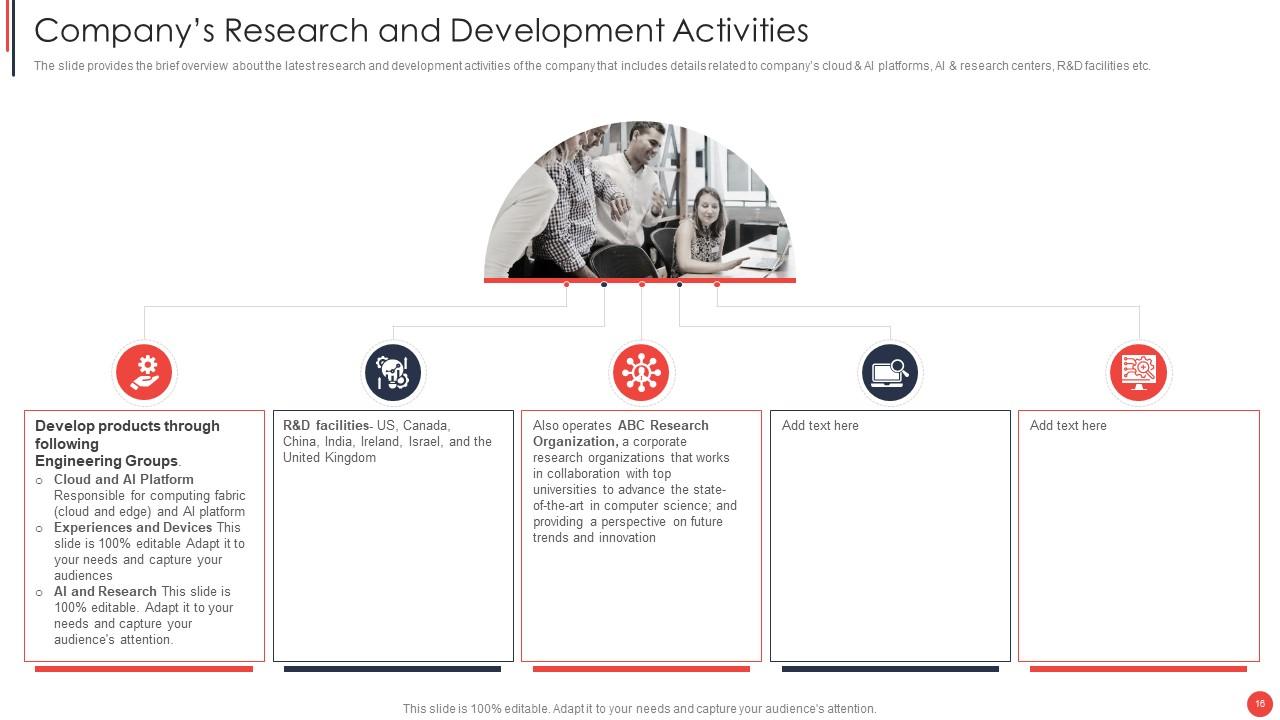
Slide 16: The slide provides the brief overview about the latest research and development activities.
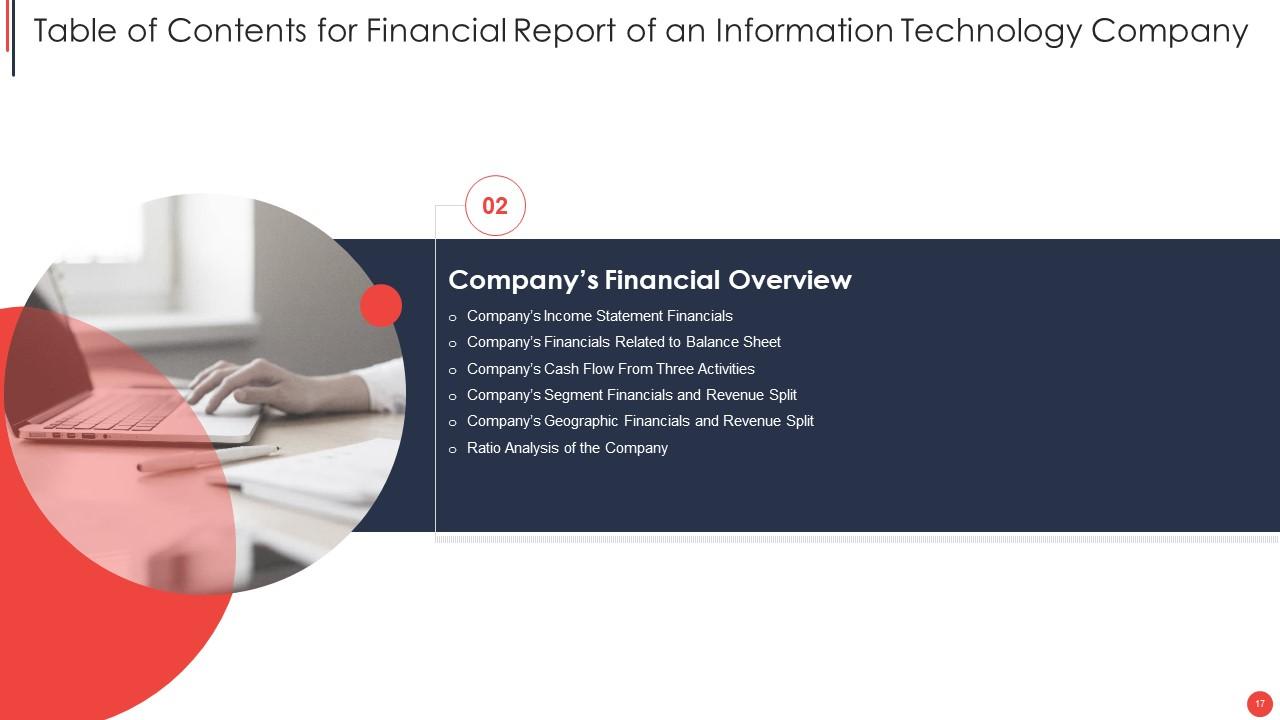
Slide 17: This slide highlights title for topics that are to be covered next in the template.
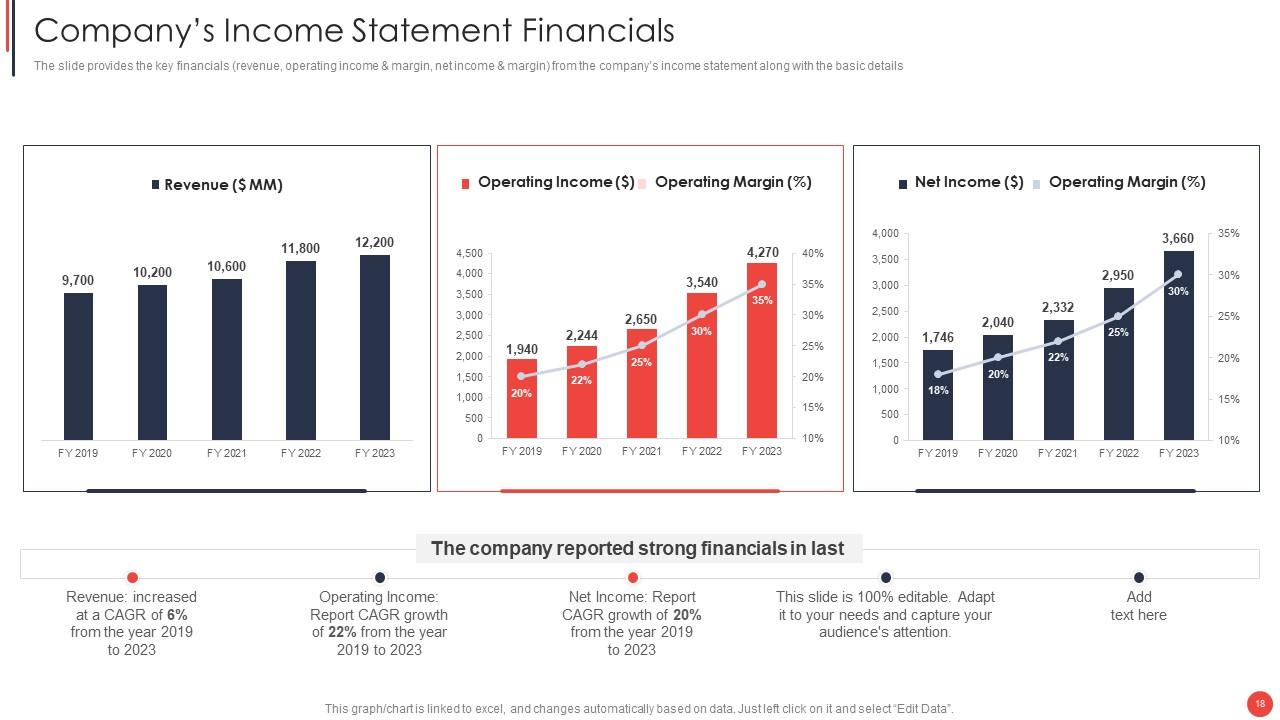
Slide 18: The slide represents the key financials (revenue, operating income & margin, net income & margin) from the company’s income statement.
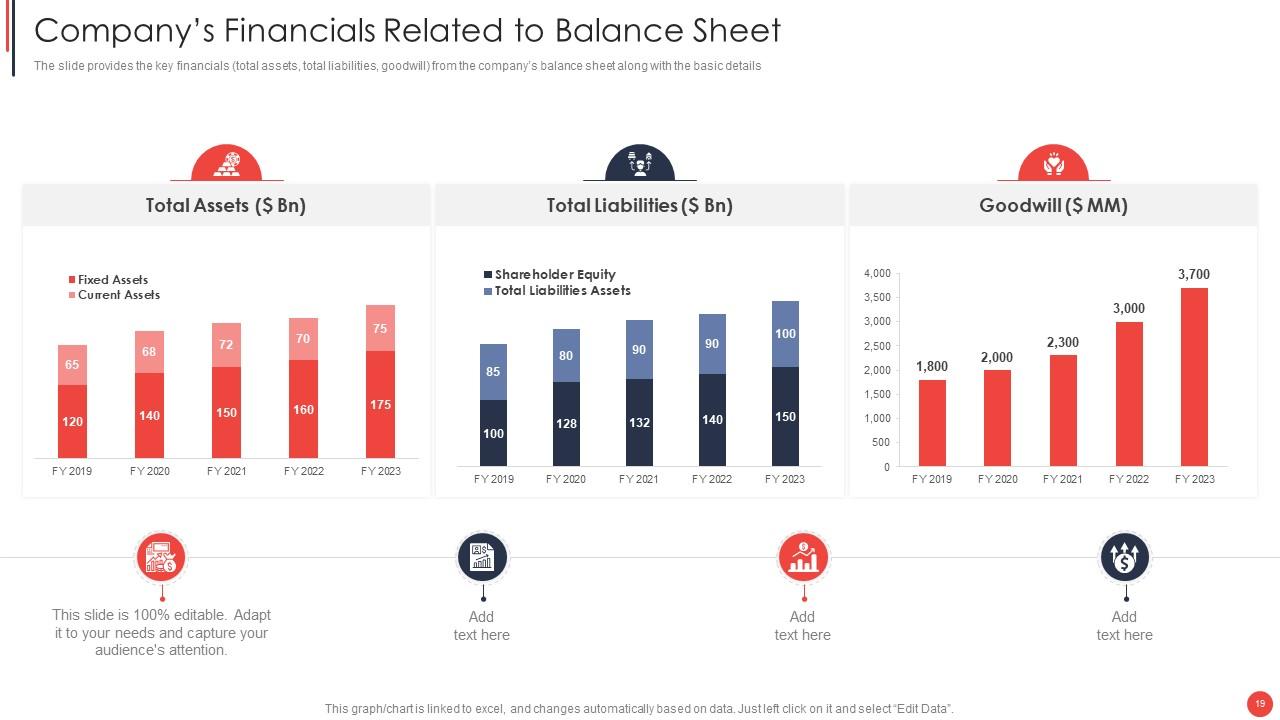
Slide 19: The slide provides the key financials (total assets, total liabilities, goodwill) from the company’s balance sheet along with the basic details
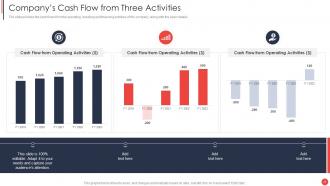
Slide 20: The slide presents the cash flows from the operating, investing and financing activities of the company.
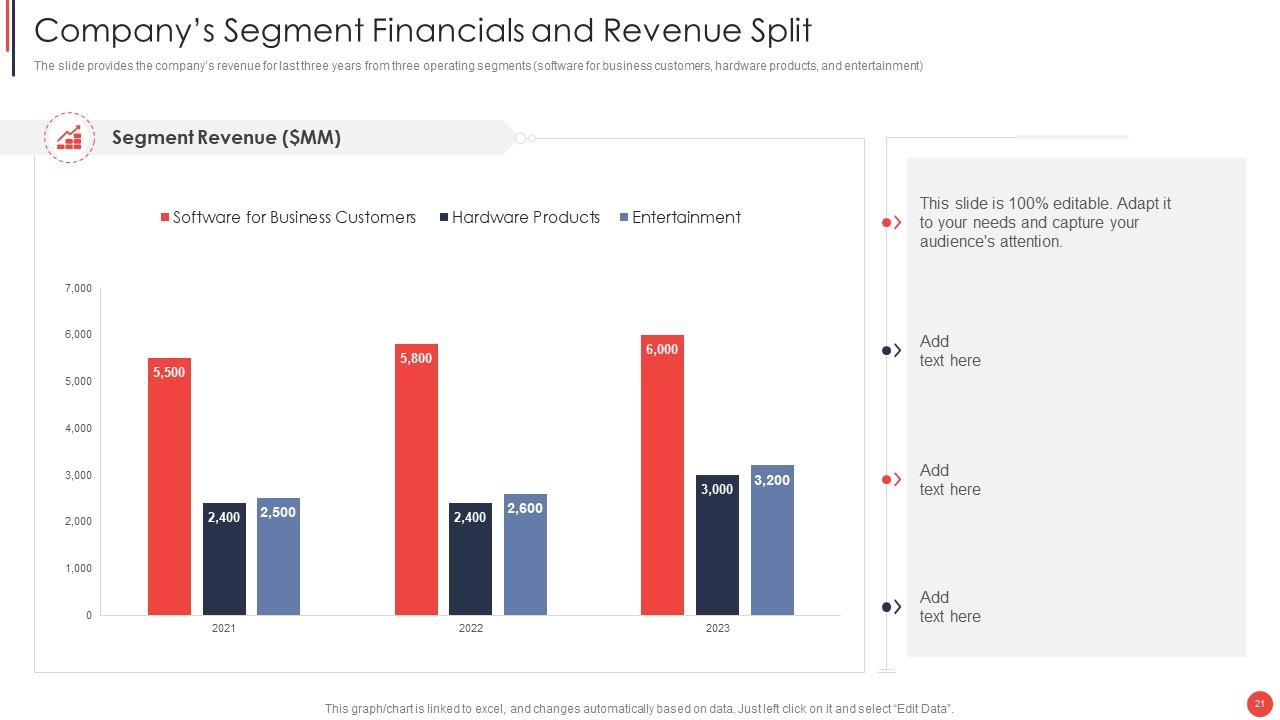
Slide 21: The slide provides the company’s revenue for last three years from three operating segments.
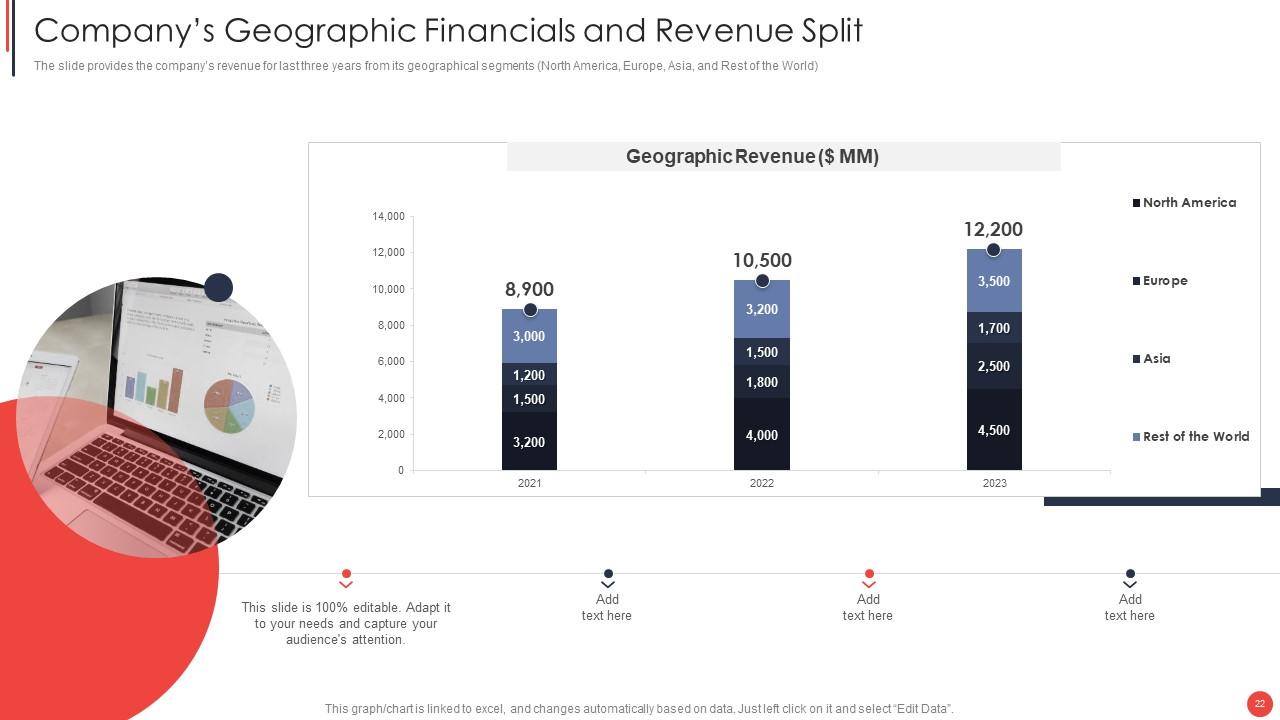
Slide 22: The slide displays the company’s revenue for last three years from its geographical segments.
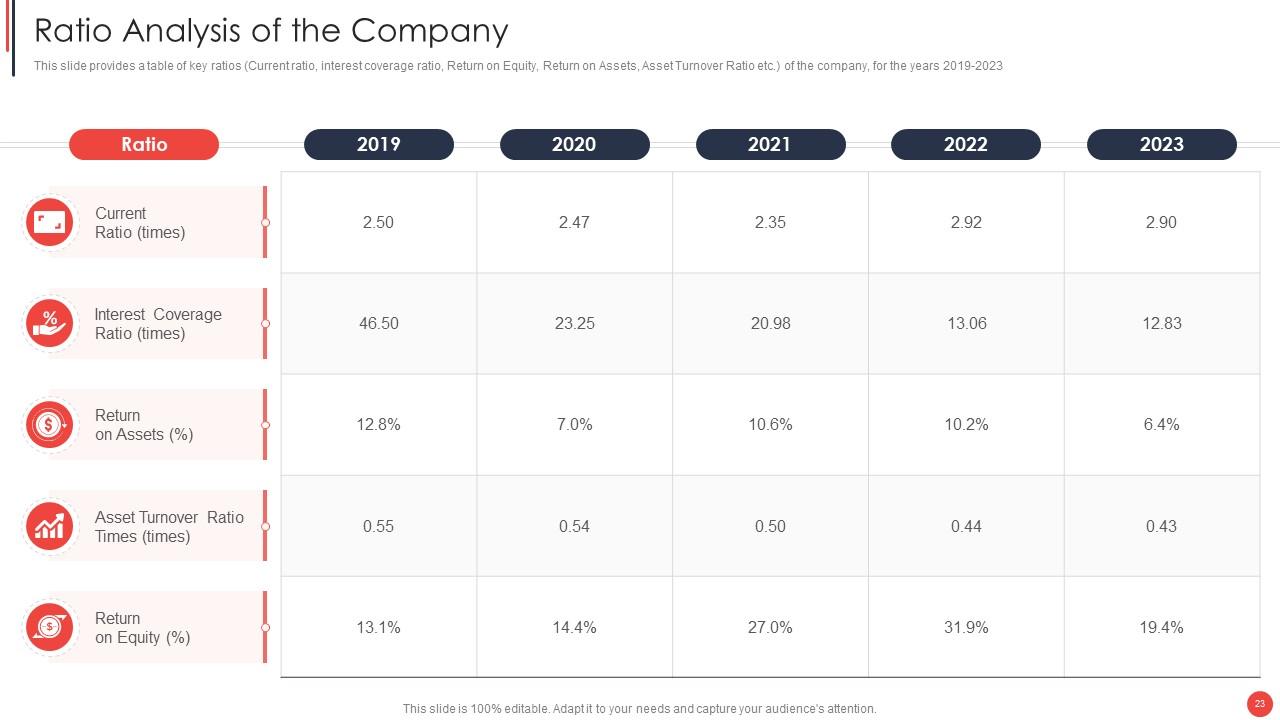
Slide 23: This slide represents a table of key ratios (Current ratio, interest coverage ratio, Return on Equity, Return on Assets, Asset Turnover Ratio etc.) of the company.
Slide 24: This slide highlights title for topics that are to be covered next in the template.
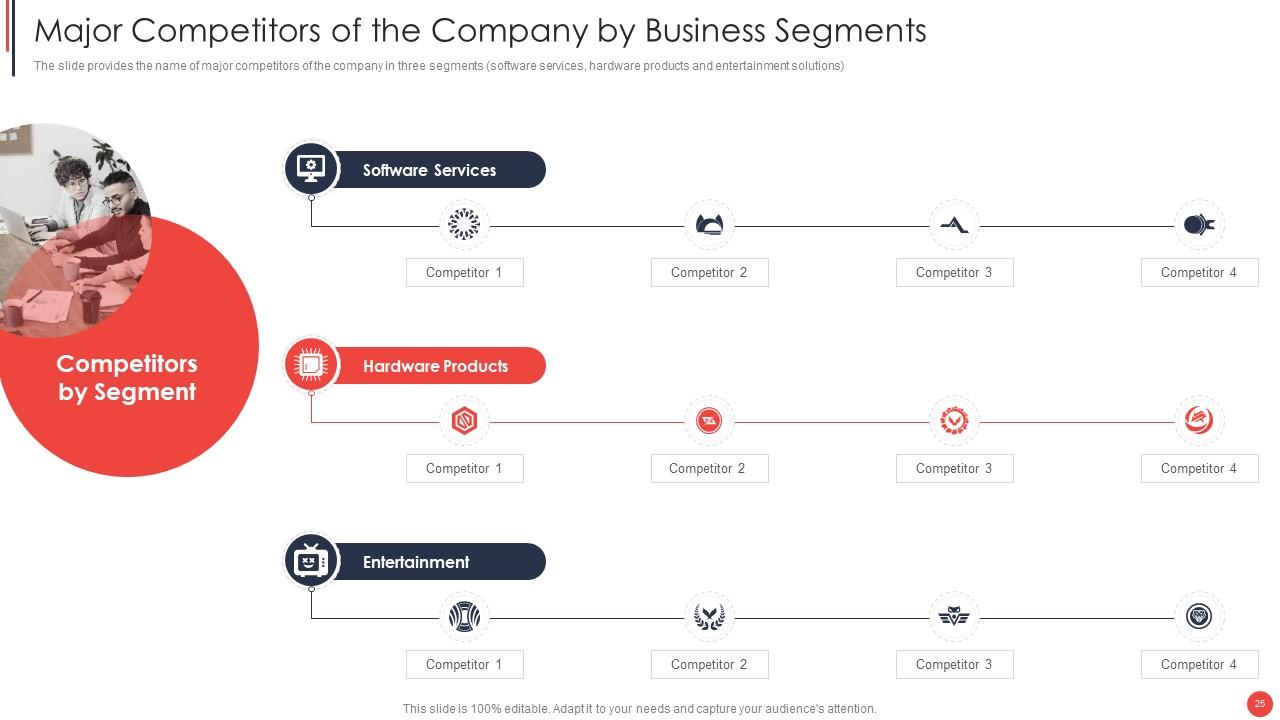
Slide 25: The slide presents the name of major competitors of the company in three segments (software services, hardware products and entertainment solutions).
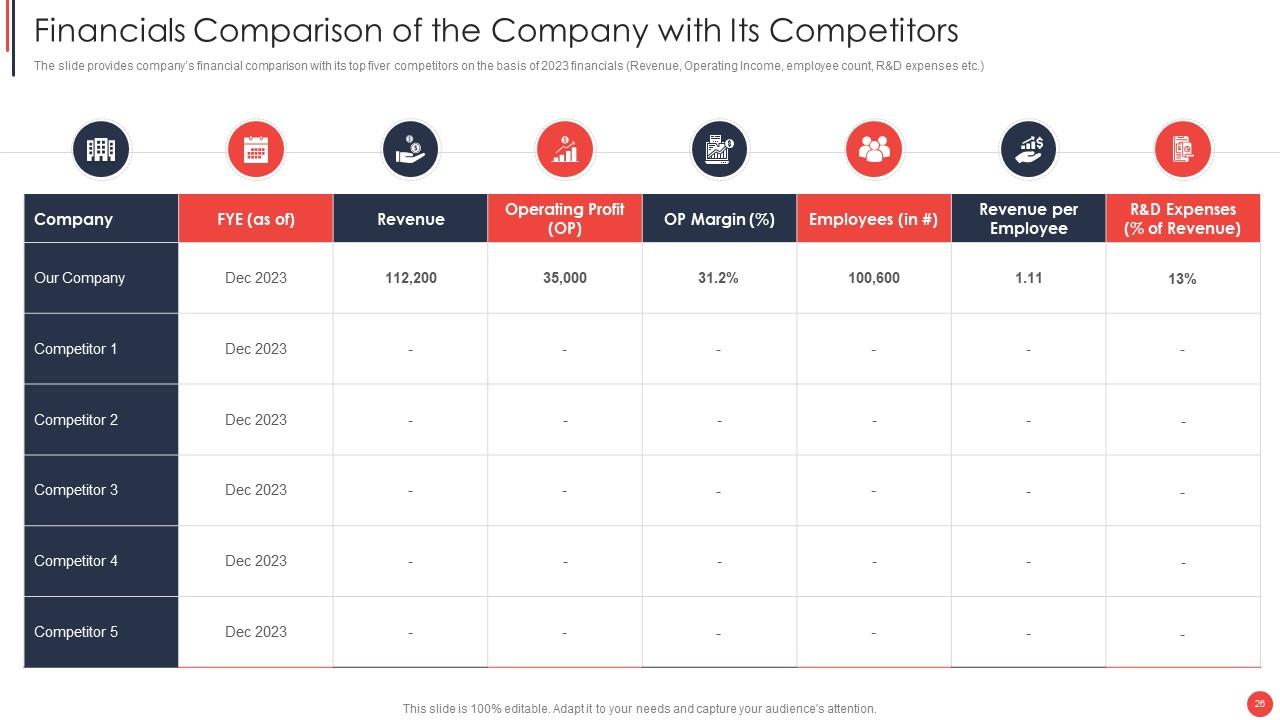
Slide 26: This slide shows Financials Comparison of the Company with Its Competitors.
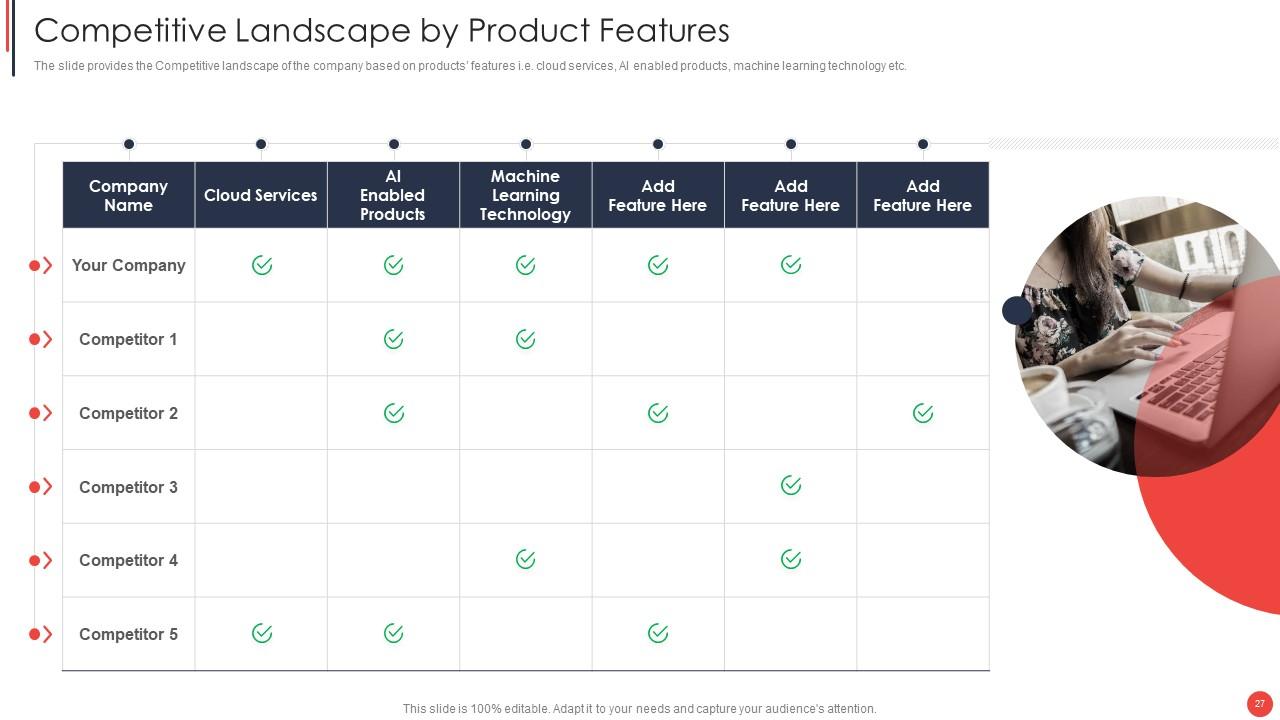
Slide 27: The slide displays the Competitive landscape of the company based on products’ features i.e. cloud services, AI enabled products, machine learning technology etc.
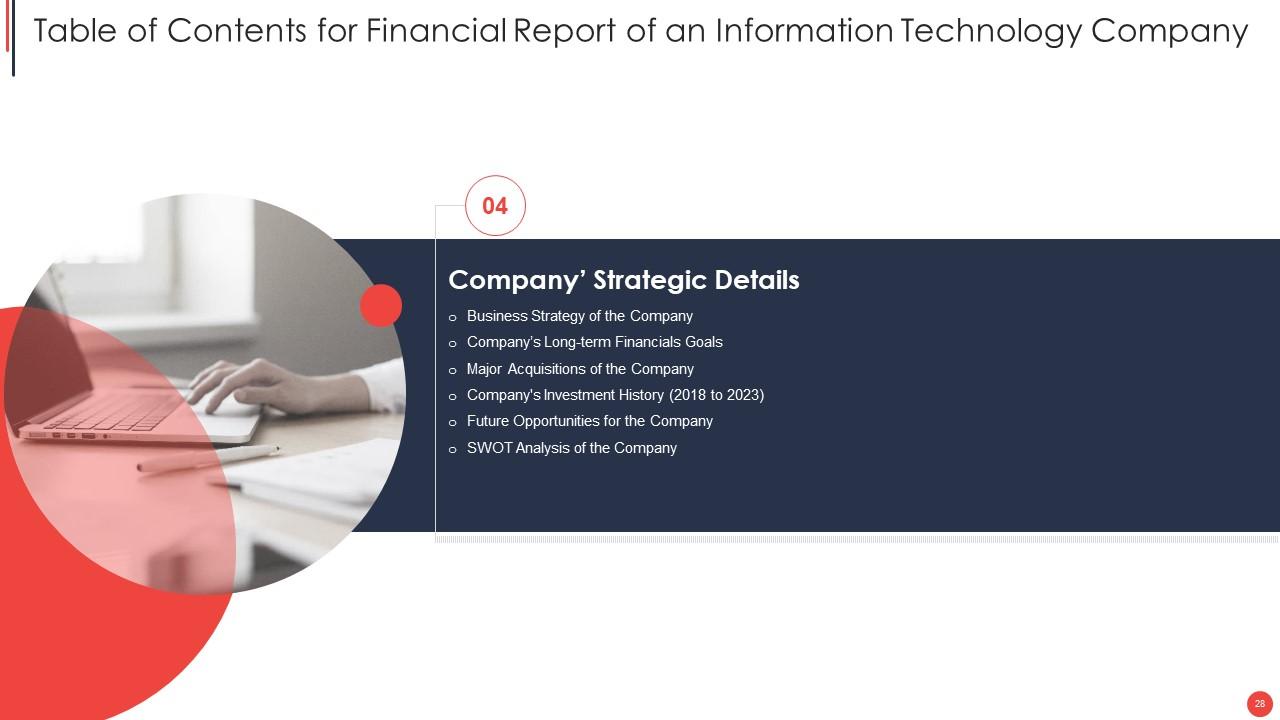
Slide 28: This slide highlights title for topics that are to be covered next in the template.
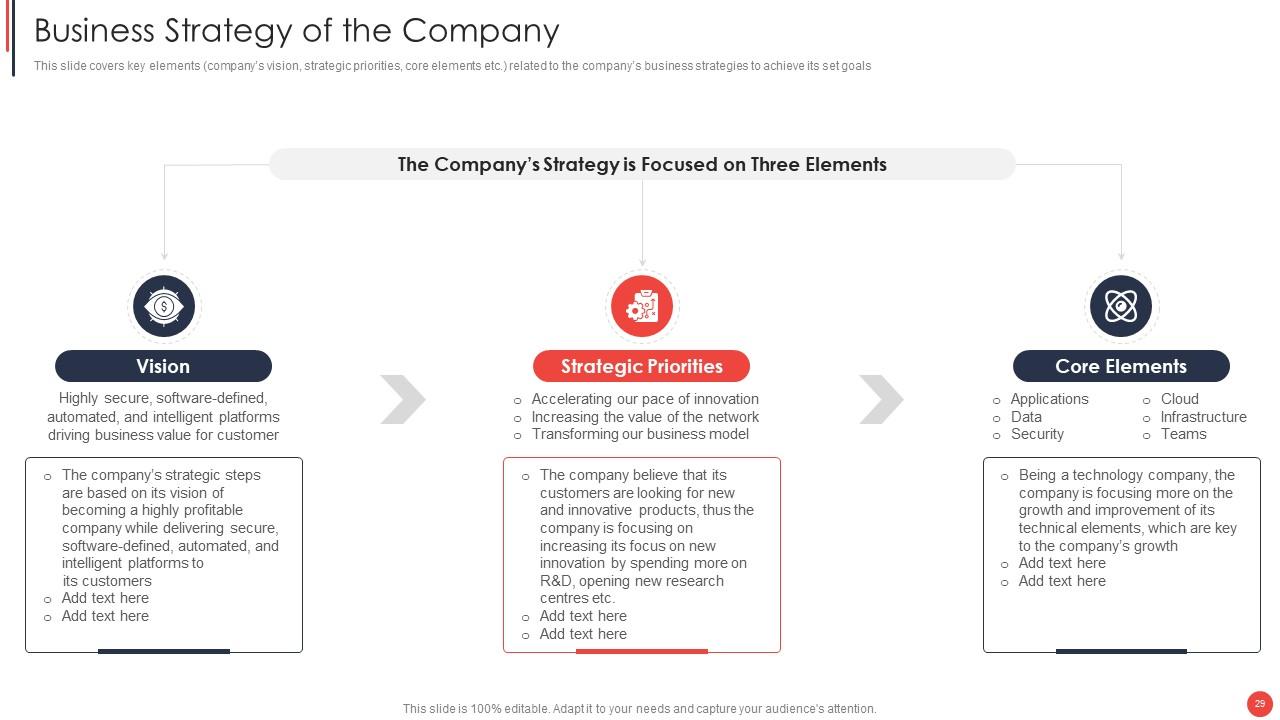
Slide 29: This slide covers key elements (company’s vision, strategic priorities, core elements etc.) related to the company’s business strategies to achieve its set goals.
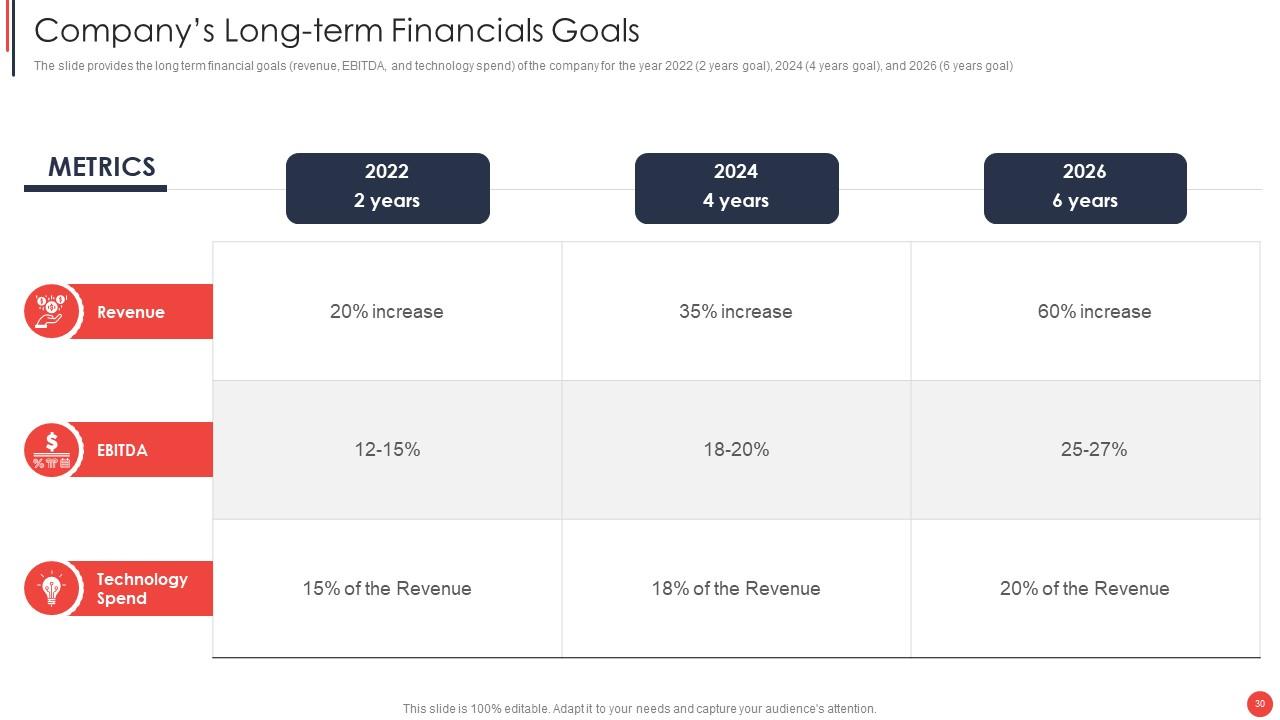
Slide 30: The slide presents the long term financial goals (revenue, EBITDA, and technology spend) of the company.
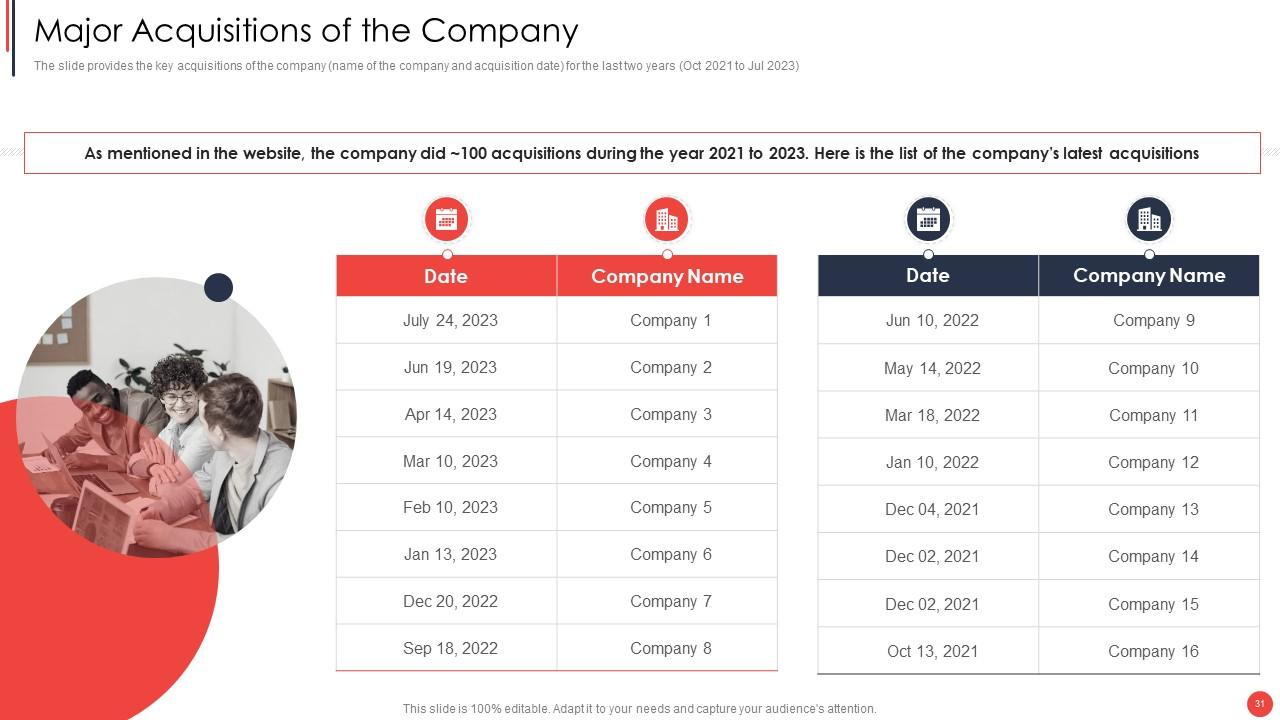
Slide 31: The slide provides the key acquisitions of the company (name of the company and acquisition date) for the last two years.
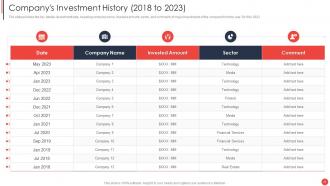
Slide 32: The slide displays the key details (investment date, investing company name, invested amount, sector, and comment) of major investments of the company.
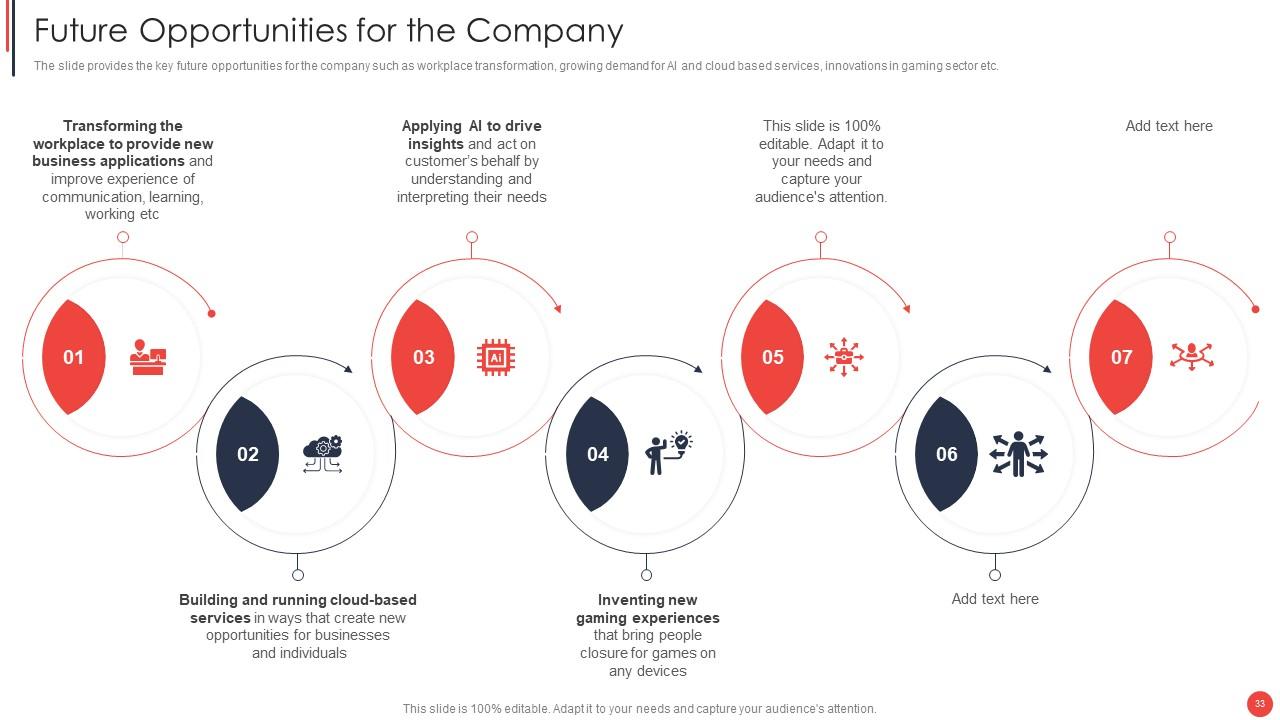
Slide 33: The slide represents the key future opportunities for the company such as workplace transformation, growing demand for AI and cloud based services.
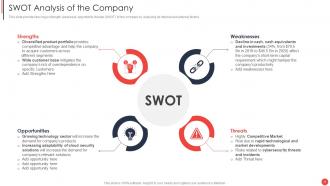
Slide 34: This slide provides the major strength, weakness, opportunity, threats (SWOT) of the company by analyzing its internal and external factors.
Slide 35: This slide highlights title for topics that are to be covered next in the template.
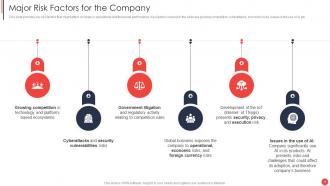
Slide 36: This slide provides key risk factors that might affect company’s operational and financials performance.
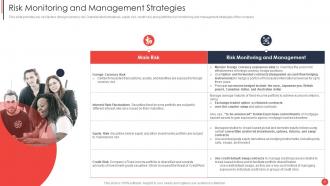
Slide 37: This slide displays key risk factors (foreign currency risk, interest rate fluctuations, equity risk, credit risk) along with the risk management strategies.
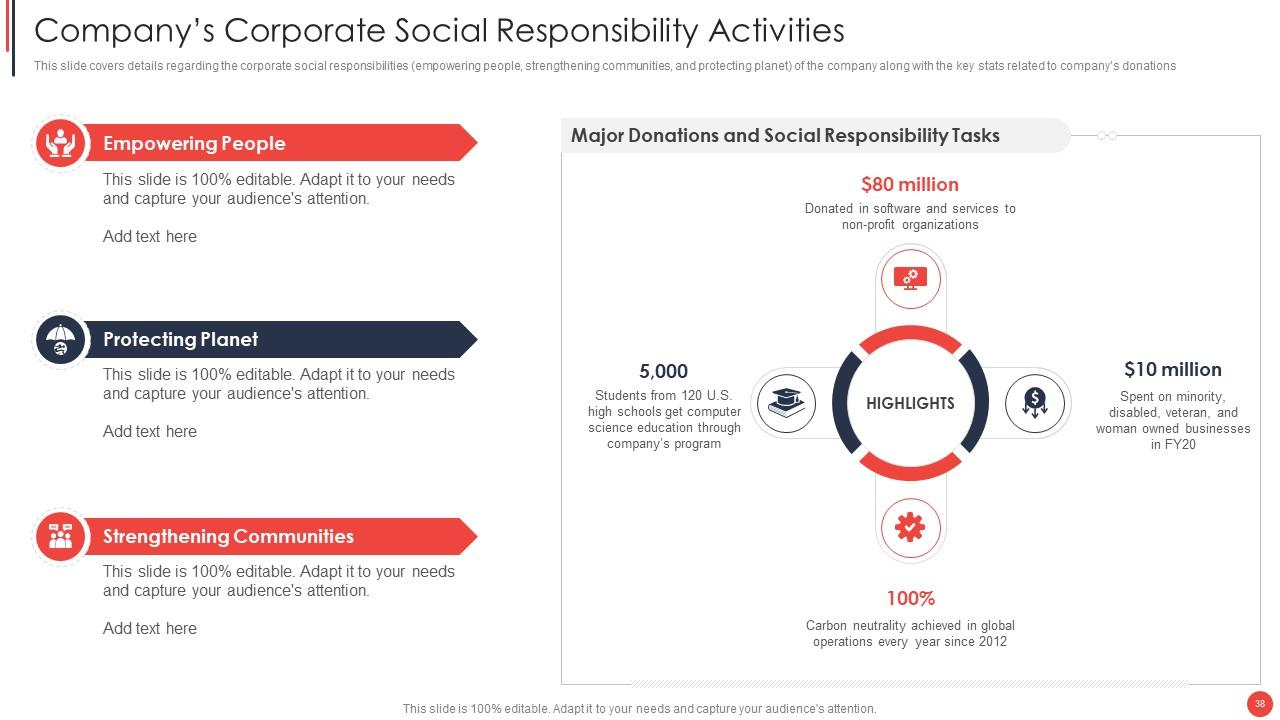
Slide 38: This slide represents Company’s Corporate Social Responsibility Activities.
Slide 39: This slide highlights title for topics that are to be covered next in the template.
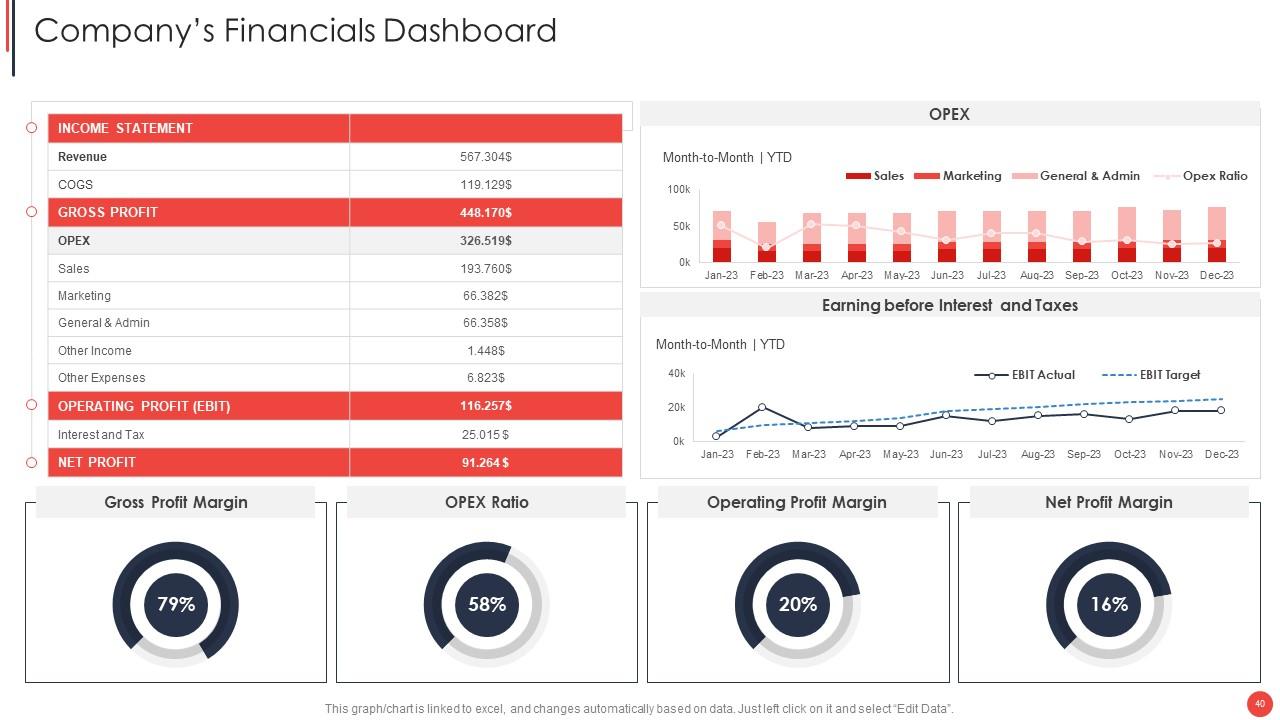
Slide 40: This slide presents Company’s Financials Dashboard with- Gross Profit Margin, Operating Profit Margin, Net Profit Margin, etc.
Slide 41: This slide displays Icons for Financial Report of an Information Technology Company.
Slide 42: This slide is titled as Additional Slides for moving forward.
Slide 43: This is About Us slide to show company specifications etc.
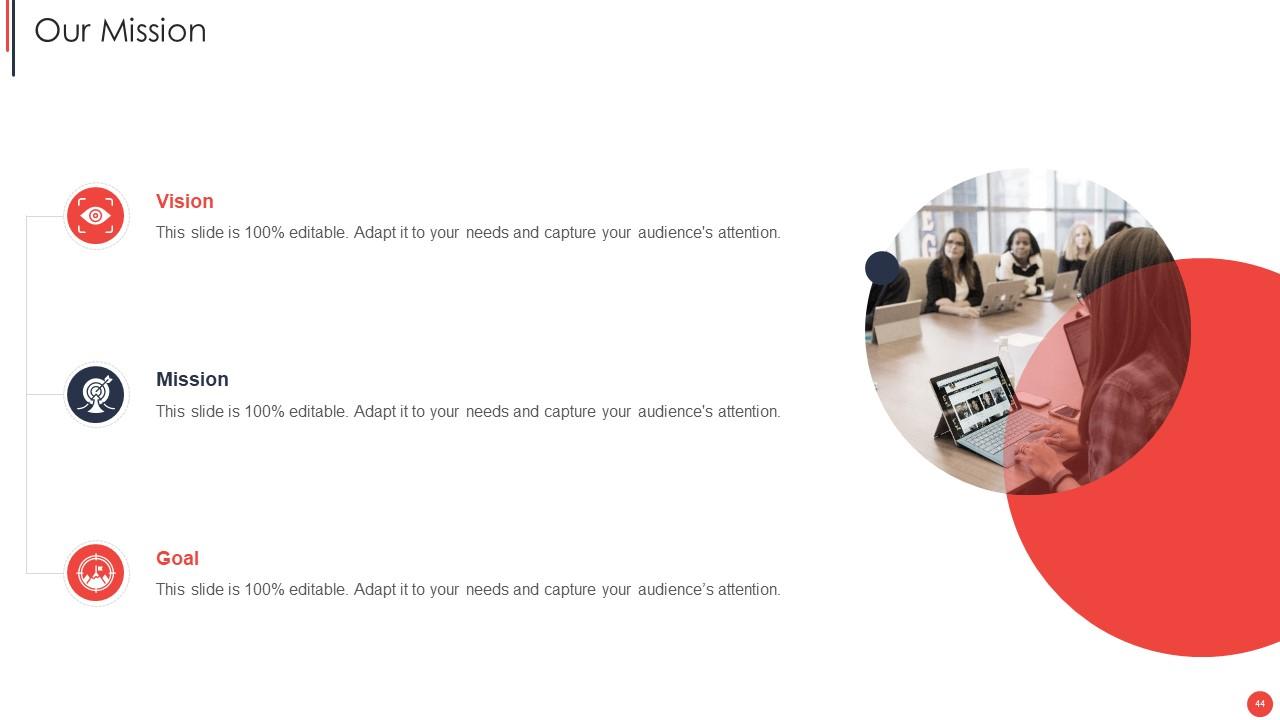
Slide 44: This is Our Mission slide with related imagery and text.
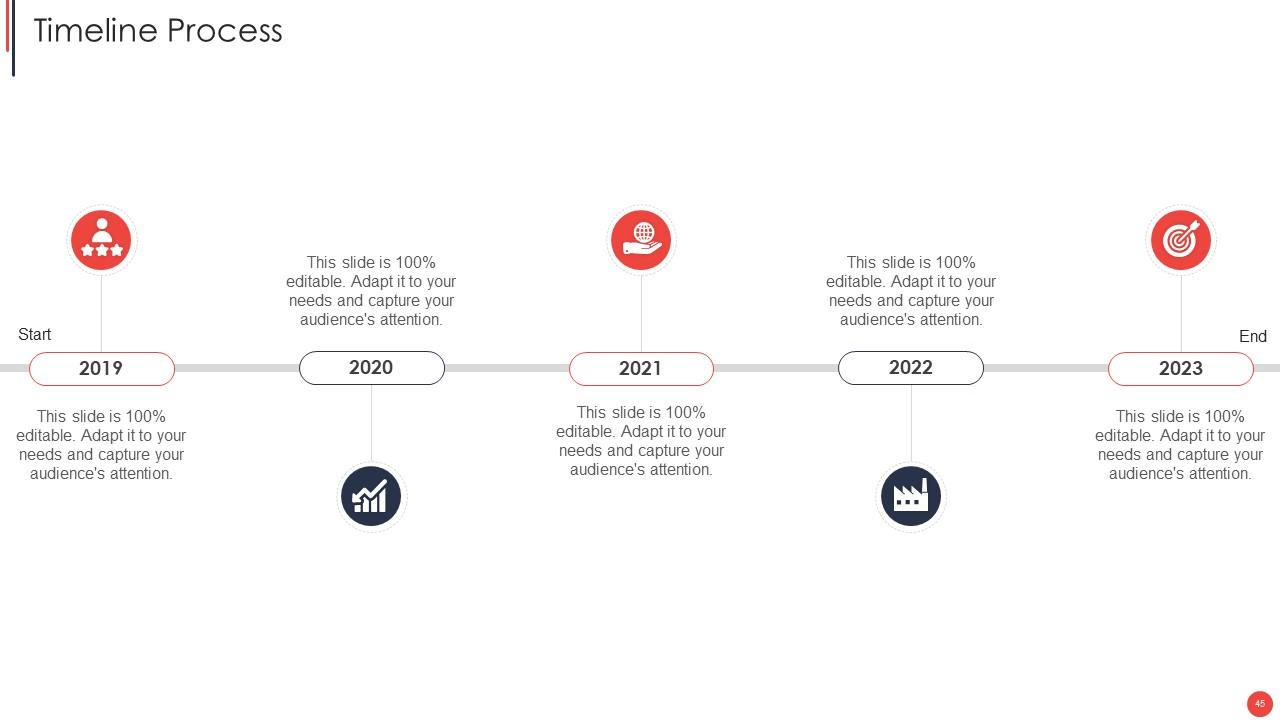
Slide 45: This is a Timeline slide. Show data related to time intervals here.
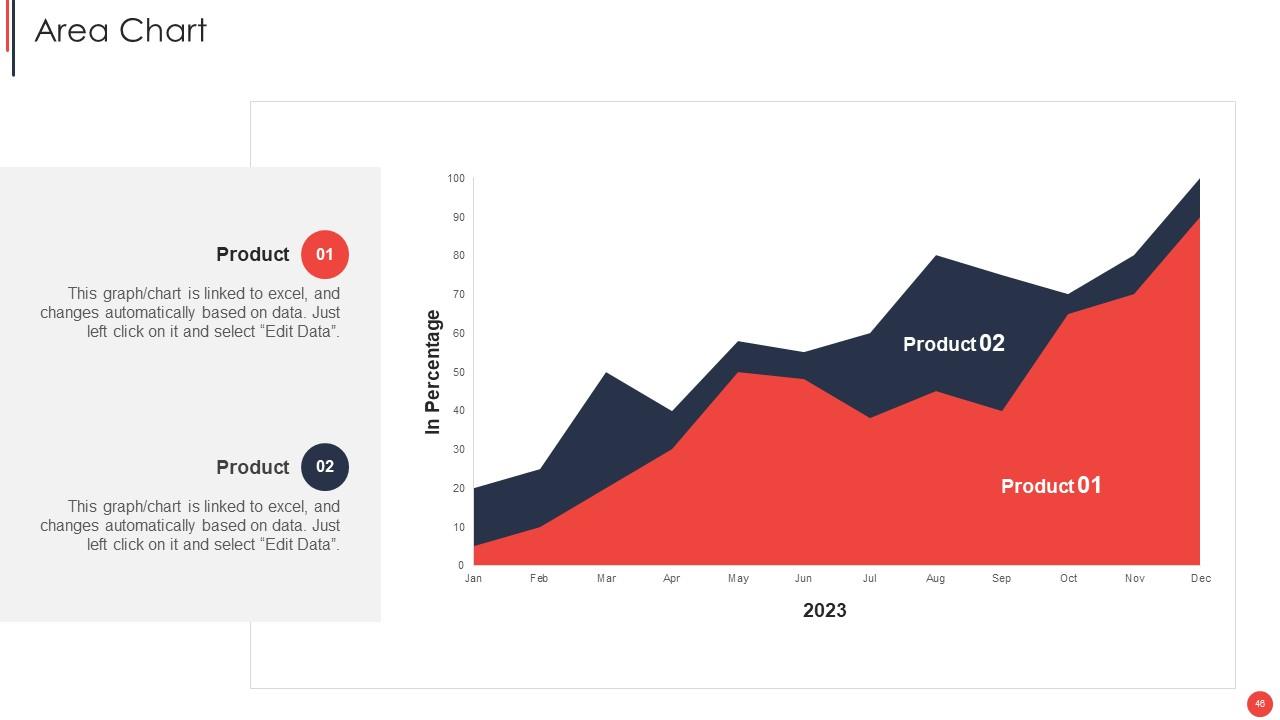
Slide 46: This slide depicts Area chart with two products comparison.
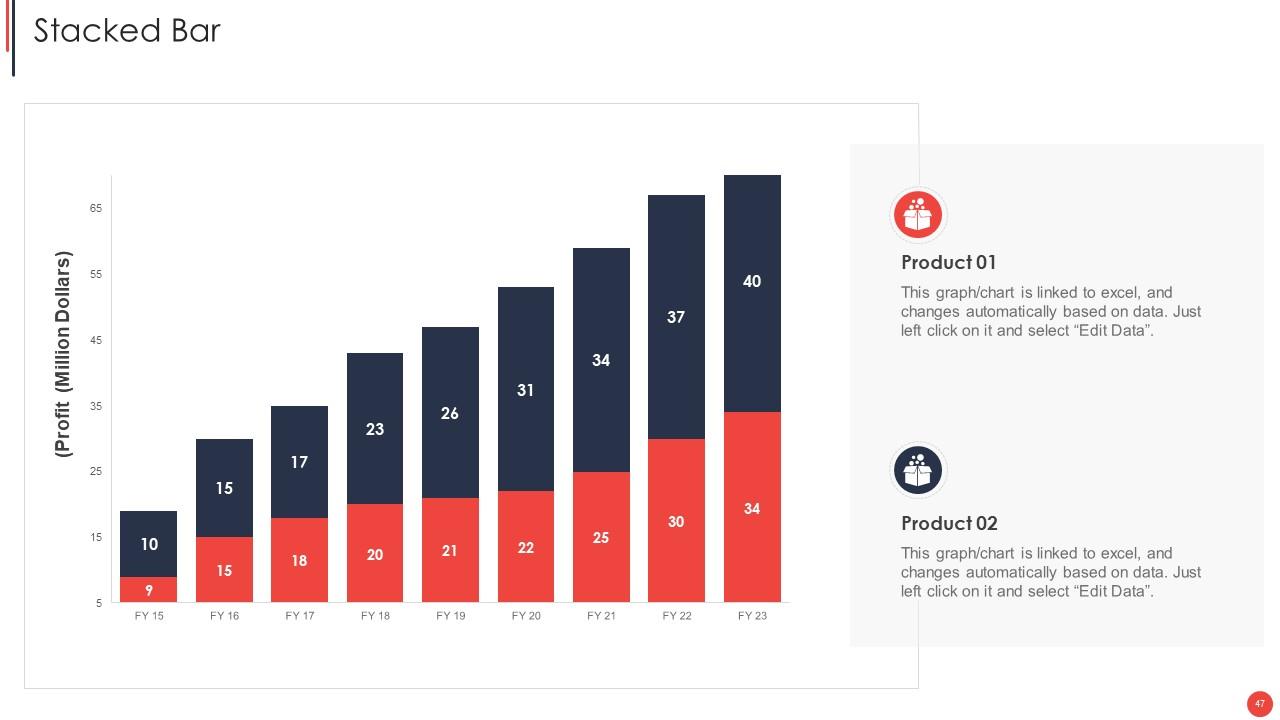
Slide 47: This slide represents Stacked Bar chart with two products comparison.
Slide 48: This slide shows Post It Notes. Post your important notes here.
Slide 49: This slide provides 30 60 90 Days Plan with text boxes.
Slide 50: This slide contains Puzzle with related icons and text.
Slide 51: This slide depicts Venn diagram with text boxes.
Slide 52: This is a Thank You slide with address, contact numbers and email address.
Financial Report Of An Information Technology Company Complete Deck with all 57 slides:
Use our Financial Report Of An Information Technology Company Complete Deck to effectively help you save your valuable time. They are readymade to fit into any presentation structure.
-
The content is very helpful from business point of view.
-
Editable templates with innovative design and color combination.


