

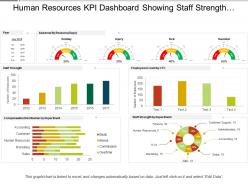
Tableau de bord Kpi des ressources humaines montrant la répartition de la rémunération de la force du personnel






Try Before you Buy Download Free Sample Product
 Impress Your
 Audience
 100%
100% Editable
 Save Hours
 of Time


Notre tableau de bord Kpi des ressources humaines montrant la répartition de la rémunération de la force du personnel PPT va vous aider à mesurer les normes de performance du capital humain. Il s'agit d'un processus en trois étapes. Les trois étapes sont le capital humain, les ressources humaines et la RH. La conception du diaporama a été rendue attrayante afin d'attirer l'attention des téléspectateurs. Les diagrammes en forme de compteur représentent également la performance des employés. Le graphique à barres montre la force du personnel travaillant dans l'organisation. Si vous êtes responsable des ressources humaines, vous devez télécharger ce modèle d'entreprise et faciliter votre travail en mesurant la répartition de la rémunération du personnel. En analysant l'effectif du personnel, on peut mesurer la charge de travail réelle. Même l'analyse de la charge de travail peut être effectuée de cette façon. Vous pouvez même savoir si vous manquez de travailleurs. Si vous téléchargez cette présentation, vous pourrez exprimer l'information facilement. Notre tableau de bord Kpi des ressources humaines montrant la répartition de la rémunération de la force du personnel excelle à dissiper la brume. Votre objectif ressort clairement.
People who downloaded this PowerPoint presentation also viewed the following :
Tableau de bord Kpi des ressources humaines montrant la répartition de la rémunération de la force du personnel avec les 6 diapositives :
Identifiez les réclamations exagérées avec notre tableau de bord Kpi des ressources humaines indiquant la répartition de la rémunération de la force du personnel. Avertissez les gens d'être trompés.
-
Human Resources KPI Dashboard Showing Staff Strength
-
Human Resources KPI Dashboard Showing Staff Strength Compensation Distribution
-
Human Resources KPI Dashboard Showing Staff Strength Compensation Distribution
-

Edit Excel linked Chart
-
Edit Color
-
Human Resources KPI Dashboard Showing Staff Strength Compensation Distribution
FAQs for Human resources kpi dashboard showing staff
Honestly, stick to the basics that actually matter. Turnover rate, time-to-hire, and employee satisfaction scores are your core three - they tell you if people are happy and if you're hiring efficiently. Cost-per-hire and absenteeism give you the money/productivity angle. Training completion is clutch because you'll know if people are actually developing. Performance review completion rates are weirdly telling too (managers hate doing them on time). Diversity metrics if your company cares about that stuff. Keep it to like 6-8 total though. Pick what you'll actually use to make decisions, not just pretty charts for leadership meetings.
Honestly, HR dashboards are game-changers for catching people before they bail. You'll see stuff like engagement scores dropping or someone hasn't gotten promoted in forever - major red flags. Instead of scrambling after someone quits, you're actually ahead of it. Track patterns too - maybe your marketing team keeps hemorrhaging people or new hires vanish after three months. That tells you something's broken that needs fixing. I'd pick 3-4 key warning signs and set alerts when they get sketchy. Way better than exit interviews after the damage is done.
Oh man, there are tons of options for HR dashboards. Power BI and Tableau are probably the best if you don't mind learning something new - they're pretty robust. Looker Studio is free though, so that's where I'd start honestly. Excel works too if you get creative with it. BambooHR has some decent built-in stuff that might save you headaches. Klipfolio's another good one. I'd mess around with the free options first, then see what you actually need before spending money. You'll probably realize half the metrics you thought were important... aren't.
Honestly, monthly reviews are usually fine for most HR stuff. Time-to-hire and absenteeism though? Those need weekly checks, maybe daily if you're in a crazy hiring phase. Turnover and employee satisfaction surveys can wait for quarterly updates - they don't swing wildly overnight anyway. Nobody wants to get blindsided by mass resignations, so set up alerts for the scary metrics. I'd start monthly and see what actually needs babysitting. Oh, and don't become one of those people glued to dashboards all day - that's just exhausting.
Ugh, the data situation is honestly such a nightmare. Everything's scattered across different systems - HRIS, payroll, performance tools, you name it. Formats never match up so you're stuck doing manual cleanup constantly. What really gets me though? Half the stuff we try to measure is super vague. Like "employee satisfaction" - that could mean literally anything depending on who you ask. Privacy restrictions make it worse since you can't always show the details that would actually help. Here's what worked for me: pick maybe 3-4 metrics you genuinely use for decisions. Get those dialed in first, then expand. Don't try to boil the ocean right away.
Dude, predictive analytics basically turns your HR dashboard into a fortune teller that actually works. You'll get heads up about which employees might quit based on their engagement scores and performance patterns - way better than just tracking who already left. Plus you can forecast hiring needs and spot skill gaps before they screw you over. I've seen it catch performance issues months early too, which is honestly pretty wild. Just make sure you set up those automated alerts so you're not constantly checking manually. Game changer for staying ahead of problems.
Employee engagement is like the pulse check for everything else on your HR dashboard. High engagement? You'll see better retention, less people calling out sick, higher productivity - the works. Low scores usually pop up way before turnover spikes hit, which is honestly pretty useful for getting ahead of problems. I always tell people to set alerts when it dips below baseline so you can zoom in on specific teams that might be struggling. It's weird how one metric can predict so many other issues, but engagement really does connect to almost everything you're tracking.
First thing - get your team on the same page with data entry rules. Seriously, half the headaches come from everyone doing their own thing. Set up some automated flags for when your HRIS and payroll numbers don't match (happens way too often). Monthly spot-checks are your friend here. Pull everything from one source instead of juggling random spreadsheets - that's where things get messy. Oh, and write down how you're actually calculating stuff so nobody's guessing. Regular validation checkpoints will save you from those awkward "wait, these numbers can't be right" moments in meetings.
So for recruitment KPIs, definitely start with time-to-fill and cost-per-hire - those are your bread and butter. Quality of hire is huge too, like 90-day retention and how new people actually perform once they're in. Source effectiveness tells you which job boards or whatever are worth your money. Oh, and candidate experience scores matter more than people think since bad reviews can totally tank your employer brand. Honestly though? Don't go crazy tracking everything or you'll hate your life. These five will give you what you need to make real decisions about where to spend your time and budget.
So basically, you'll want to track stuff that actually shows if your culture's changing - employee engagement, who's quitting under which managers, diversity numbers, internal promotions. The cool part is spotting patterns you'd miss otherwise. Like, maybe one team is crushing it while another's falling apart, or your promotion process is totally broken somewhere. Honestly, seeing it all mapped out is kind of shocking sometimes. Pick maybe 3-5 metrics that match where you're trying to go as a company, then check them monthly. Use that data to have real talks with leadership about what's not working.
Honestly, the worst thing you can do is cram like 30 metrics on one screen - I've seen it and it's just chaos. Stick to maybe 5-7 that actually matter for your goals. Also huge mistake: tracking vanity metrics that look impressive but don't help you make real decisions. Your executives want different stuff than your recruiting team does, so think about who's actually using this thing. Oh and make sure your data updates regularly because stale numbers make you look terrible. I'd say start basic first - you can always add more complexity later once people actually start using it.
First figure out what your company's actual top priorities are this year - could be revenue, retention, expansion, whatever. Map your HR metrics straight to those goals. Cost cutting? Track turnover expenses and how long it takes to fill roles. Growth mode? Measure new hire productivity or internal promotions. Most HR dashboards are honestly just fluff that execs completely ignore. You want to show how your people stuff connects to the numbers leadership obsesses over. Oh, and don't set it once and forget it - review quarterly and tweak your KPIs as needed.
Honestly? Less is way more with these things. Pick maybe 5-7 metrics that actually connect to business goals - executives hate digging through spreadsheets. Visual charts are your friend here. Color-code everything so trends pop out right away, and always add context like month-over-month or industry benchmarks. The story behind the data matters more than just showing numbers (learned this the hard way). Oh, and don't forget next steps at the end. People want to know what to DO with all this info, not just stare at pretty graphs.
Honestly, real-time tracking is such a lifesaver compared to waiting around for quarterly reports. You can actually see if your retention stuff is working and catch people checking out before they quit. When leadership starts asking those awkward questions about headcount, you'll have fresh data instead of scrambling. I used to hate the whole "wait and see" thing we did before - felt like flying blind half the time. You can tweak strategies as things happen instead of realizing three months later that everything went sideways. My advice? Pick your top 3-5 metrics that actually change and automate those first.
Track completion rates and satisfaction scores first - those are easy wins. But here's what really matters: test knowledge retention with before/after assessments, then see if people actually apply skills back at work. Performance improvements over 3-6 months tell the real story. ROI calculations are annoying but necessary - compare productivity gains to training costs. Promotion rates between participants vs everyone else always impresses executives (trust me on this one). Set up monthly dashboards now so you're not frantically pulling numbers later when your boss asks.
-
Wonderful templates design to use in business meetings.
-
Nice and innovative design.